
|
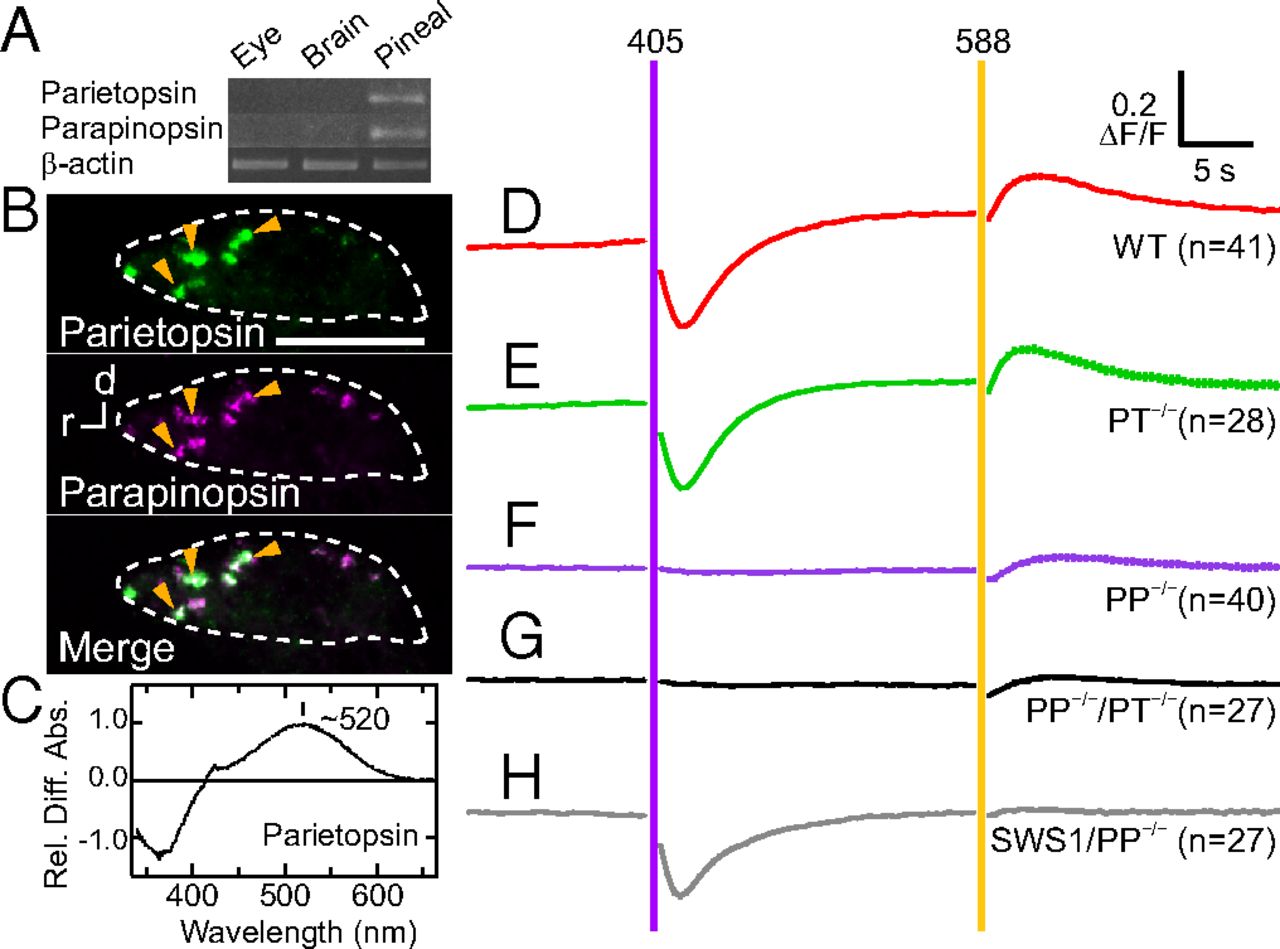
Fig. 2
Contribution of opsins to color opponency in PP cells under two-photon imaging. (A) RT-PCR analyses of parietopsin and parapinopsin expression in the eye, brain, and pineal organ of zebrafish. (B) In situ hybridization analyses of two opsins in the zebrafish pineal organ using the double fluorescence method. Yellow arrowheads in B indicate coexpression of two opsins in the zebrafish pineal organ. Orientations marked with “d” and “r” indicate the dorsal and rostral sides, respectively. The white dotted traces indicate the landmarks of the pineal organ. (Scale bars: 100 µm.) (C) Relative difference absorption spectrum of zebrafish parietopsin before minus after light irradiation. The spectrum is shown as an average of three measurements. (D–H) Calcium level changes upon 405- or 588-nm light stimuli in PP cells of WT (D; n = 41), parietopsin-KO (E; PT−/−, n = 28), parapinopsin-KO (F; PP−/−, n = 40), double-KO (G; PP−/−/PT−/−, n = 27), and SWS1 opsin-expressing/parapinopsin-KO fish (H; SWS1/PP−/−, n = 27). Error bars indicate SE. The light intensities of 405- and 588-nm light stimuli in D–H were ∼3.2 × 10¹⁴ and ∼5.4 × 10¹⁷ photons per cm2·s, respectively. The durations of both stimuli were ∼450 ms. ∆F/F values are change rates of normalized fluorescence intensity with the averaged intensity of 10 points before initial light stimuli. Statistical evaluation of the differences in amplitudes of calcium level changes among the WT and mutants are shown in SI Appendix, Fig. S5 A and B.