
- Title
-
Fast Dynamic in vivo Monitoring of Erk Activity at Single Cell Resolution in DREKA Zebrafish.
- Authors
- Mayr, V., Sturtzel, C., Stadler, M., Grissenberger, S., Distel, M.
- Source
- Full text @ Front Cell Dev Biol
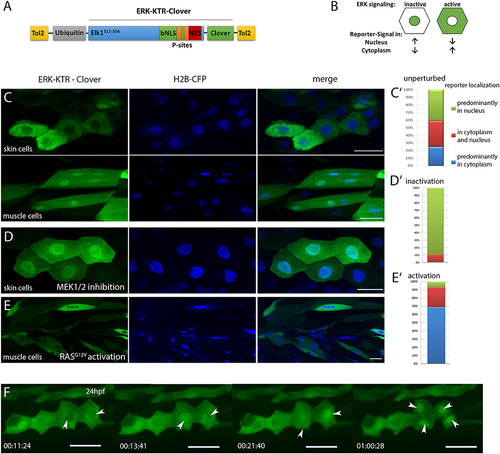
Characterization of ubi:ERK-KTR-Clover in zebrafish embryos. (A) Schematic illustration of the DREKA transgenesis vector pDESTubi:ERK-KTR-CloverpATol2. (Tol2, Tol2 recombinase recognition sites; ubiquitin, ubiquitin promoter; Elk1312−356, ERK docking sites from Elk1; bNLS, bipartite nuclear localization signal; P-sites, phosphorylation sites; NES, nuclear export signal; modified after Regot et al., 2014) (B) Schematic depiction of the ERK-KTR reporter principle. ERK signaling inactive: reporter is mainly localized in the nucleus; ERK signaling active: reporter is localized in the cytoplasm sparing the nucleus. (C) pDESTubi:ERK-KTR-CloverpATol2 and H2B-CFP mRNA co-injected wildtype zebrafish embryos express ERK-KTR-Clover in a mosaic manner. mClover fluorescence is mainly found in the cytoplasm of skin epithelial cells, indicating active Erk signaling (upper panel) and in the nucleus of muscle cells indicating absence of Erk signaling activity (lower panel). (C′) Quantification of ERK-KTR localization in skin epithelial cells and muscle cells at 48 hpf. Green, mClover fluorescence in the nucleus; Red, mClover fluorescence distributed throughout the cell; Blue, mClover fluorescence in the cytoplasm sparing the nucleus (n = 385 cells, 10 embryos at 48 hpf). (D) Skin epithelial cells of co-injected embryos incubated with MEK1/2 inhibitor PD98059 (30 μM) overnight show mClover fluorescence in the nucleus at 48 hpf indicating the reporter responds to Mek inhibition. (D′) Quantification of mClover localization shows reporter shuttling to the nucleus after MEK1/2 inhibition (n = 300 cells, 5 embryos at 48 hpf). (E) Muscle cells expressing constitutively active HRAS (zebrafish injected with pDESTubi:ERK-KTR-CloverpATol2, H2B-CFP:UAS:HRASG12V, and KalTA4 mRNA Distel et al., 2009) show active Erk signaling at 48 hpf. (E′) Quantification of mClover localization shows constitutively active HRAS induced reporter shuttling to the cytoplasm (n = 235 cells, 5 embryos at 48 hpf). (F) Mitotic skin epithelial cells of pDESTubi:ERK-KTR-CloverpATol2 injected zebrafish at 24 hpf. Dividing skin epithelial cells (white arrowheads) show dynamic Erk signaling with a sudden change from cytoplasmic to nuclear reporter localization before cytokinesis [compare time points 11:24 min/13:41 min (left arrowhead) and 13:41 min/21:40 min (right arrowhead)]. After cytokinesis the reporter remains in the nuclei of both daughter cells (arrowheads at 1:00:28 h). Images taken from a time-lapse movie (Movie 2) are maximum projections of several planes. All scale bars are 25 μm. All images were recorded on a Leica SP8 X WLL confocal microscope and rendered using Photoshop CS6. |
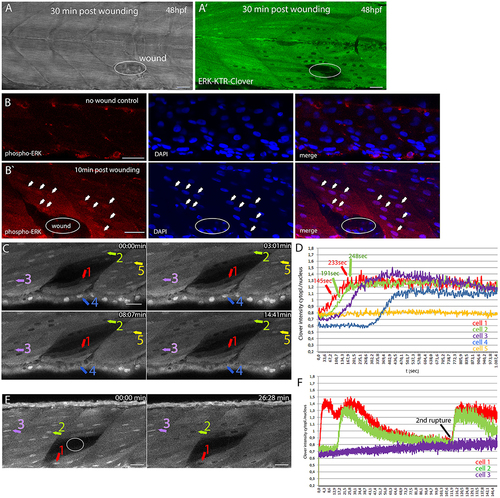
Monitoring dynamic Erk activity in DREKA zebrafish (A) Brightfield image and fluorescence image (A′) of a DREKA embryo wounded with a glass needle at 48 hpf. Images were taken 30 min after wounding. Active Erk signaling was observed in muscle cells around the wound (n = 6 embryos). (B) Immunofluorescence staining for phosphorylated Erk (red) in muscle cells of control and zebrafish embryos wounded with a glass needle 10 min post-wounding (B′). DAPI staining is shown in blue. Arrows mark some of the cells with phosphorylated Erk being visible in the nucleus surrounding the wound (circle). (C) Erk signaling activation in muscle and skin epithelial cells after laser induced wounding in 54 hpf DREKA. Four time points (0, 3, 8, and 14 min) taken from time-lapse Movie 3 show the fast activation of Erk signaling. (D) Quantification of Erk activity in 5 cells as depicted in (C) starting ~65 s post-wound appearance. Erk activity is shown as cytoplasmic/nuclear ratio of mClover intensity over time (seconds). Cells close to the wound [#1(red) and #2(green)] show a fast response with higher reporter concentrations in the cytoplasm compared to the nucleus around 145 s (cell #1) and 191 s (cell #2) post-wound appearance and peaking after ~233 s (cell #1) and 248 s (cell #2), respectively. Cells further away respond later [#3(purple)] or remain inactive [#5(yellow)]. In addition to muscle cells, Erk signaling activation was also observed in skin epithelial cells [#4(blue)]. (E) Erk signaling activity in response to laser induced wounding of muscle cells in 72 hpf DREKA. mClover fluorescence (shown in gray) at 0 and 26 min after the wound (circle) has been introduced (see Movie 4). After wounding mClover starts to localize from the nucleus to the cytoplasm in cells directly adjacent to the wound, indicating Erk signaling activation (cell #1). Muscle cells further away from the wound become active for Erk signaling at later time points (cell #2) or remain inactive (cell #3). (F) Quantification of Erk activity in 3 cells as shown in (E) over 2.5 h starting ~40 s post-wound appearance (see Movie 4). Erk signaling activity is shown as cytoplasmic to nuclear mClover intensity over time (minutes) for one muscle cell close to the wound (#1 red), one muscle cell further away (#2 green), and one non-responding muscle cell (3# purple) (colored arrows in E). Note the second rupture event leading to a rapid activation of Erk signaling. All scale bars are 25 μm. All images were recorded on a Leica SP8 X WLL confocal microscope and rendered using Photoshop CS6. |
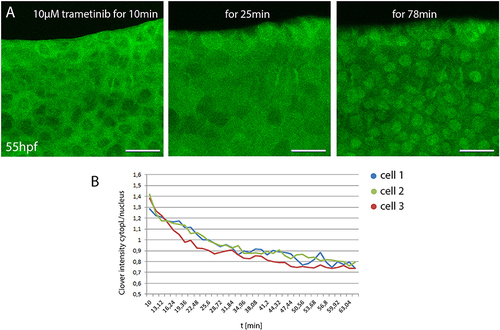
Monitoring small compound uptake kinetics in DREKA zebrafish (A) 55 hpf DREKA embryos were embedded in agarose containing 10 μM trametinib to investigate compound uptake kinetics in skin epithelial cells. After 10 min skin epithelial cells still show active Erk signaling. Around 20 min Erk activity is visibly decreased and by 50–60 min cells show full Erk signaling inhibition. (B) Quantification of Erk activity over time. Cytoplasmic to nuclear mClover intensity over time in three representative skin epithelial cells in DREKA zebrafish treated with 10 μM trametinib at 55 hpf. All scale bars are 25 μm. All images were recorded on a Leica SP8 X WLL confocal microscope and rendered using Photoshop CS6. |
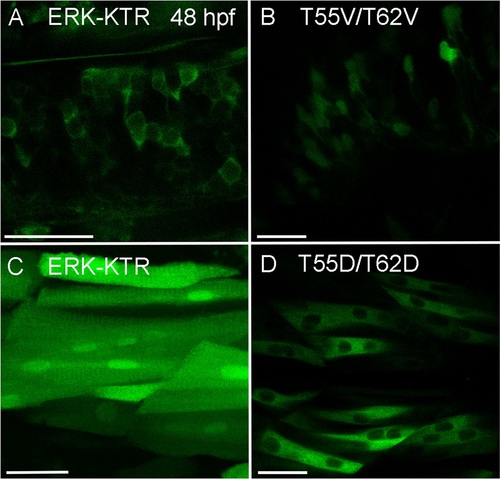
Localization of ERK-KTR control constructs T55V/T62V and T55D/T62D. 48 hpf zebrafish embryos expressing either ERK-KTR-mClover or T55V/T62V and T55D/T62D control reporter constructs. (A) Neural cells within the CNS expressing ERK-KTR-mClover. The reporter localizes to the cytoplasm. (B) The T55V/T62V control reporter is also found in the nucleus of neural cells within the CNS. (C) Muscle cells expressing ERK-KTR-mClover. (D) The phosphomimetic T55D/T62D reporter construct localizes predominantly to the cytoplasm when expressed in muscle cells. All scale bars are 25 μm. Images were recorded on a Leica Sp8 X WLL confocal system and rendered with Adobe Photoshop CS6. |
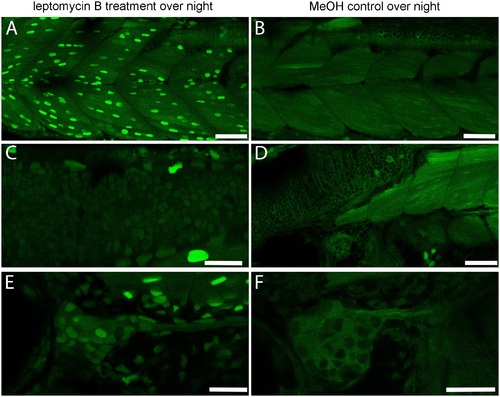
Effects of nuclear export inhibition by leptomycin B. 26 hpf DREKA zebrafish larvae were treated with the nuclear export inhibiting compound leptomycin B at 92 μM for 24 h. (A,C,E) Treated DREKA, (B,D,F) untreated control DREKA. Muscle cells (A,B), neural cells in the hindbrain (C,D), and cranial ganglion cells (E,F) all show increased reporter signal in the nucleus in treated embryos compared to untreated siblings. Scale bars in (A,B,D) are 50 μm, in (C,E,F) 25 μm. Images were recorded on a Leica Sp8 X WLL confocal system using a 25x objective. Images were rendered using Adobe Photoshop CS6. |