
|
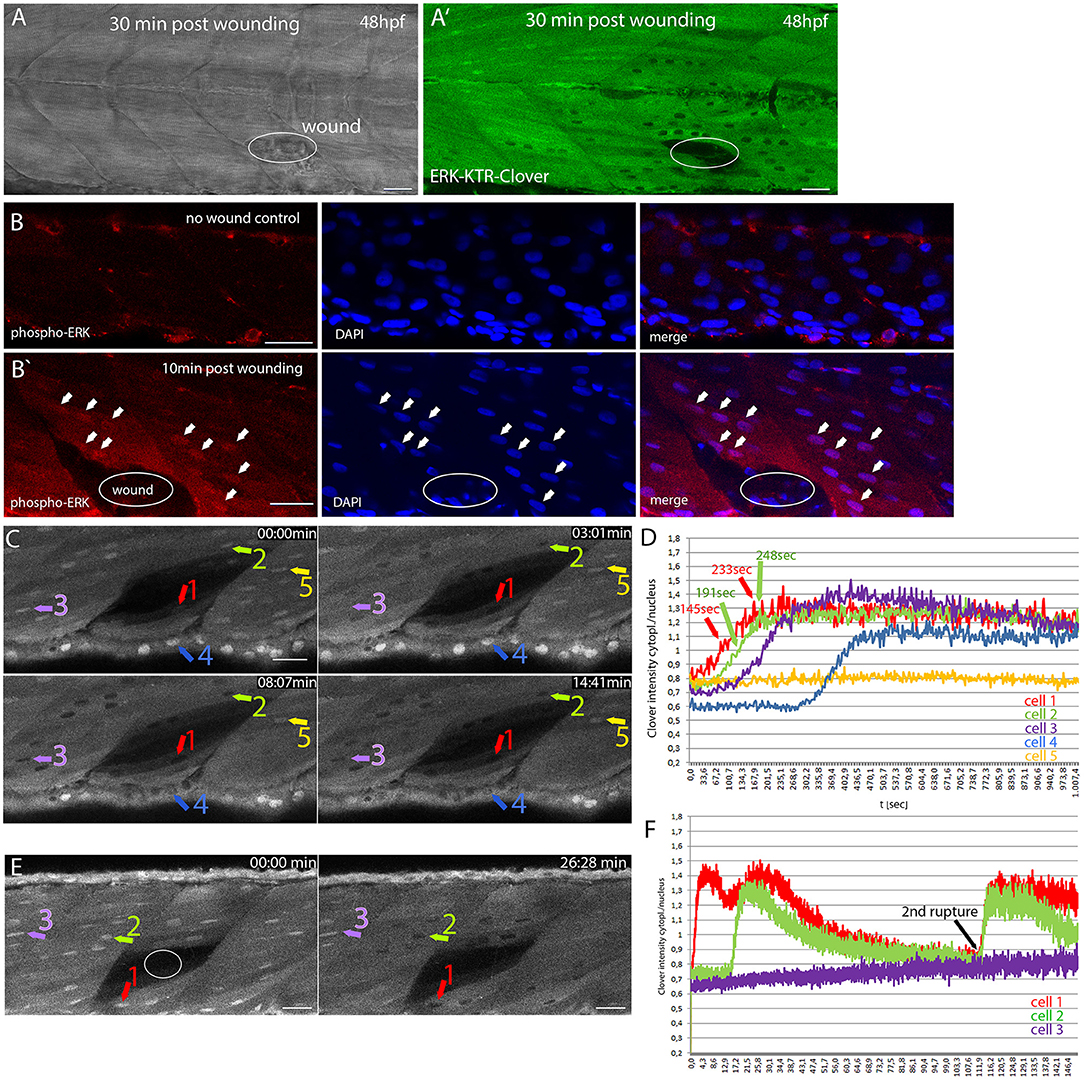
Fig. 2
Monitoring dynamic Erk activity in DREKA zebrafish (A) Brightfield image and fluorescence image (A′) of a DREKA embryo wounded with a glass needle at 48 hpf. Images were taken 30 min after wounding. Active Erk signaling was observed in muscle cells around the wound (n = 6 embryos). (B) Immunofluorescence staining for phosphorylated Erk (red) in muscle cells of control and zebrafish embryos wounded with a glass needle 10 min post-wounding (B′). DAPI staining is shown in blue. Arrows mark some of the cells with phosphorylated Erk being visible in the nucleus surrounding the wound (circle). (C) Erk signaling activation in muscle and skin epithelial cells after laser induced wounding in 54 hpf DREKA. Four time points (0, 3, 8, and 14 min) taken from time-lapse Movie 3 show the fast activation of Erk signaling. (D) Quantification of Erk activity in 5 cells as depicted in (C) starting ~65 s post-wound appearance. Erk activity is shown as cytoplasmic/nuclear ratio of mClover intensity over time (seconds). Cells close to the wound [#1(red) and #2(green)] show a fast response with higher reporter concentrations in the cytoplasm compared to the nucleus around 145 s (cell #1) and 191 s (cell #2) post-wound appearance and peaking after ~233 s (cell #1) and 248 s (cell #2), respectively. Cells further away respond later [#3(purple)] or remain inactive [#5(yellow)]. In addition to muscle cells, Erk signaling activation was also observed in skin epithelial cells [#4(blue)]. (E) Erk signaling activity in response to laser induced wounding of muscle cells in 72 hpf DREKA. mClover fluorescence (shown in gray) at 0 and 26 min after the wound (circle) has been introduced (see Movie 4). After wounding mClover starts to localize from the nucleus to the cytoplasm in cells directly adjacent to the wound, indicating Erk signaling activation (cell #1). Muscle cells further away from the wound become active for Erk signaling at later time points (cell #2) or remain inactive (cell #3). (F) Quantification of Erk activity in 3 cells as shown in (E) over 2.5 h starting ~40 s post-wound appearance (see Movie 4). Erk signaling activity is shown as cytoplasmic to nuclear mClover intensity over time (minutes) for one muscle cell close to the wound (#1 red), one muscle cell further away (#2 green), and one non-responding muscle cell (3# purple) (colored arrows in E). Note the second rupture event leading to a rapid activation of Erk signaling. All scale bars are 25 μm. All images were recorded on a Leica SP8 X WLL confocal microscope and rendered using Photoshop CS6.