
- Title
-
Neutrophil-specific knockout demonstrates a role for mitochondria in regulating neutrophil motility in zebrafish
- Authors
- Zhou, W., Cao, L., Jeffries, J., Zhu, X., Staiger, C.J., Deng, Q.
- Source
- Full text @ Dis. Model. Mech.
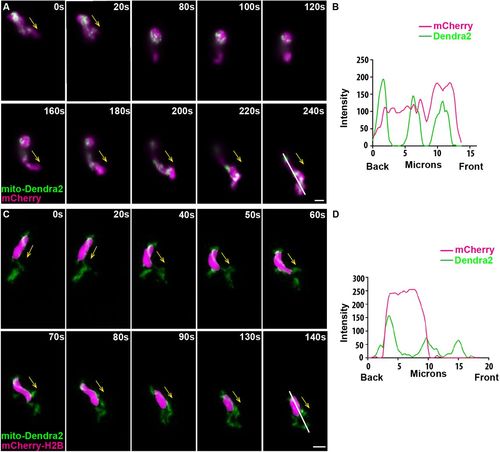
Mitochondria localize to both the front and the rear of neutrophils. (A) Random motility of neutrophils in the head mesenchyme of a 3 dpf larvae of Tg(lyzC:mitoDendra2)p14 crossed with Tg(lyzC:mCherry). (B) Quantification of fluorescence intensity along the indicated line (at 240 s). (C) Tg(lyzC:mitoDendra2)pu14 was crossed with Tg(lyzC:mCherry-H2B) to visualize mitochondria network relative to the nucleus. (D) Quantification of fluorescence intensity along the indicated line (at 140 s). Montages of one representative movie out of eight are shown. Arrows indicate the direction of cell migration. Scale bars: 5 µm. |
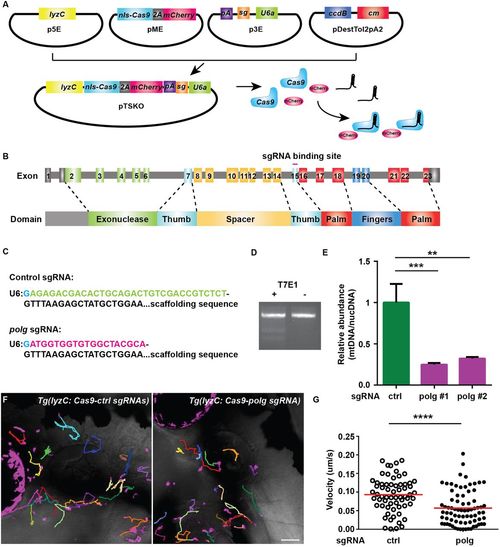
Neutrophil-specific knockout of polg reduced neutrophil motility. (A). Schematic of the design of gateway vectors to clone constructs for neutrophil-specific knockout. (B) Schematic of the gene structure and protein domains of zebrafish polg gene. The sgRNA targets exon 15 in the forward strand. (C) Sequences of sgRNAs (control or polg) produced using our vectors. Note that the first G (blue) is included in the backbone. (D,E) Neutrophils were sorted from 3 dpf embryos of Tg(lyzC:nls-cas9-2A-mCherry/U6a/c:control sgRNA)pu15 (TS-ctrl) and Tg(lyzC:nls-cas9-2A-mCherry/U6a:polg sgRNA)pu16 (TS-polg) lines. T7E1 assay was performed to show the in vivo editing of the polg locus (D), and the ratio of mitochondrial DNA/nuclear DNA content was measured by qPCR in two separate sorts (E). ***P<0.001, **P<0.01 by one-way ANOVA. (F,G) Representative images (F) and quantification (G) of neutrophil motility in the head mesenchyme of 3 dpf larvae. One representative result from three biological repeats is shown. n=64 for TS-ctrl (ctrl) and n=76 for TS-polg (polg) from four different larvae. ****P<0.0001 by Mann–Whitney test. Scale bar: 50 µm. |
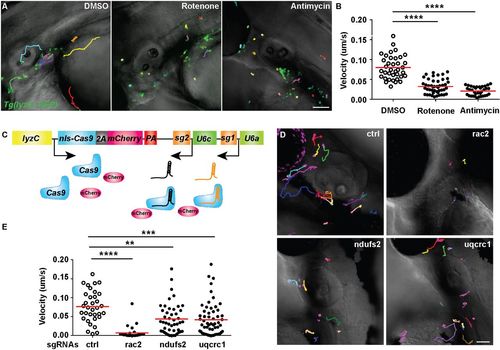
Mitochondria complex I and III regulate neutrophil motility. (A,B) Tg(lyzC:GFP) at 3 dpf was treated with DMSO, rotenone or antimycin. Representative images (A) and quantification (B) of neutrophil motility in the head mesenchyme. One representative result from three biological repeats is shown. n=37 for DMSO, n=46 for rotenone and n=35 for antimycin from four different larvae. ****P<0.0001 by Kruskal–Wallis test. (C) Schematic of the vector used to produce two different sgRNAs. (D,E) Representative images (D) and quantification (E) of neutrophil motility in the head mesenchyme with neutrophil-specific transient knockout of rac2 (positive control), ndufs2 or uqcrc1. One representative result from three biological repeats is shown. n=34 for control (ctrl), and n=30 for rac2, n=46 for ndufs2 and n=58 for uqcrc1 knockouts from four different larvae. ****P<0.0001, ***P<0.001, **P<0.01 by Kruskal–Wallis test. Scale bars: 50 µm. |
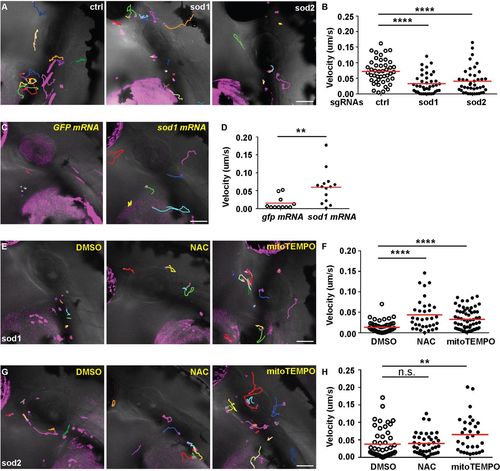
Mitochondria redox status regulates neutrophil motility. (A,B) Representative images (A) and quantification (B) of neutrophil motility in the head mesenchyme with neutrophil-specific transient knockout of sod1 and sod2 using the plasmids described in Fig. 3C. One representative result from three biological repeats is shown. n=36 for control (ctrl), and n=40 for sod1 and n=42 for sod2 knockouts from four different larvae. ****P<0.0001 by Kruskal–Wallis test. (C,D) Representative images (C) and quantification (D) of neutrophil motility in embryos co-injected with the plasmid for sod1 knockout in neutrophils and sod1 mRNA or the GFP control mRNA. One representative result from three biological repeats is shown. n=11 for gfp mRNA and n=14 for sod1 mRNA from four different larvae. **P<0.01 by Mann–Whitney test. (E,F) Representative images (E) and quantification (F) of neutrophil motility in embryos injected with the plasmid for sod1 knockout in neutrophils and then treated with 1% DMSO, 200 µM NAC or 50 µM mitoTEMPO from 1 dpf. One representative result from three biological repeats is shown. n=53 for DMSO, n=34 for NAC and n=62 for mitoTEMPO from four different larvae. ****P<0.0001 by Kruskal–Wallis test. (G,H) Representative images (G) and quantification (H) of neutrophil motility in embryos injected with the plasmid for sod2 knockout in neutrophils and then treated with 1% DMSO, 200 µM NAC or 50 µM mitoTEMPO from 1 dpf. One representative result from three biological repeats is shown. n=49 for DMSO, n=40 for NAC and n=31 for mitoTEMPO from four different larvae. **P<0.01; n.s., not significant, by Kruskal–Wallis test. Scale bars: 50 µm. |
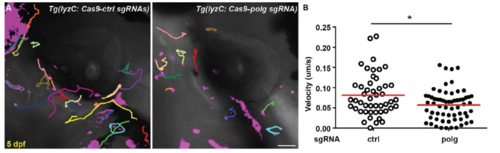
Neutrophil-specific knockout of polg reduced neutrophil motility at 5 dpf. A) Representative images and B) Quantification of neutrophil motility in the head mesenchyme of 5 dpf embryos. One representative result of three biological repeats was shown. n = 48 for ctrl and n = 63 for polg from 4 different larvae. *, p<0.05 by Mann-Whitney test. Scale bar: 50 μm. |
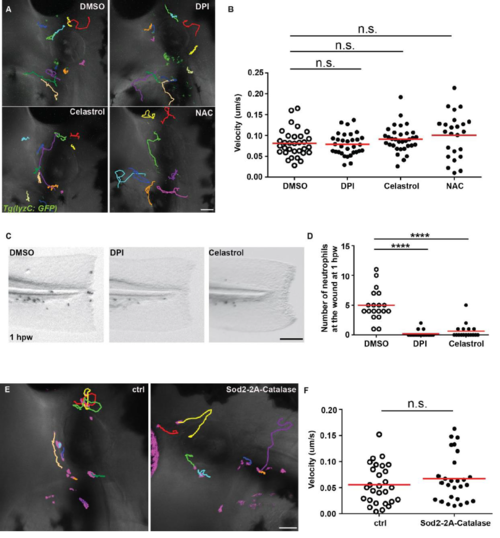
Decreasing the ROS level in neutrophils does not affect neutrophil migration. A, B) Tg (lyzC:GFP) at 3 dpf was treated with DMSO, DPI, Celastrol or NAC. A) Representative images and B) Quantification of neutrophil motility in the head mesenchyme. One representative result of three biological repeats was shown. n = 32 for DMSO, n = 32 for DPI, n = 33 for Celastrol, n = 24 for NAC from 4 different larvae. n.s., not significant by one-way ANOVA. C) Representative images and D) Quantification of neutrophil number at the wound at 1 hpw in embryos treated with DMSO, DPI, or Celastrol. One representative result of three biological repeats was shown. n = 19 for DMSO, n = 21 for DPI, n = 17 for Celastrol. ****, p<0.0001 by Kruskal-Wallis test. E) Representative images and F) Quantification of neutrophil motility in the head mesenchyme with neutrophil specific transient overexpression of Sod2. n = 28 for ctrl and n = 27 for Sod2-2A-Catalase from 4 different larvae. n.s., not significant by Mann-Whitney test. Scale bars: 50 μm. |