
|
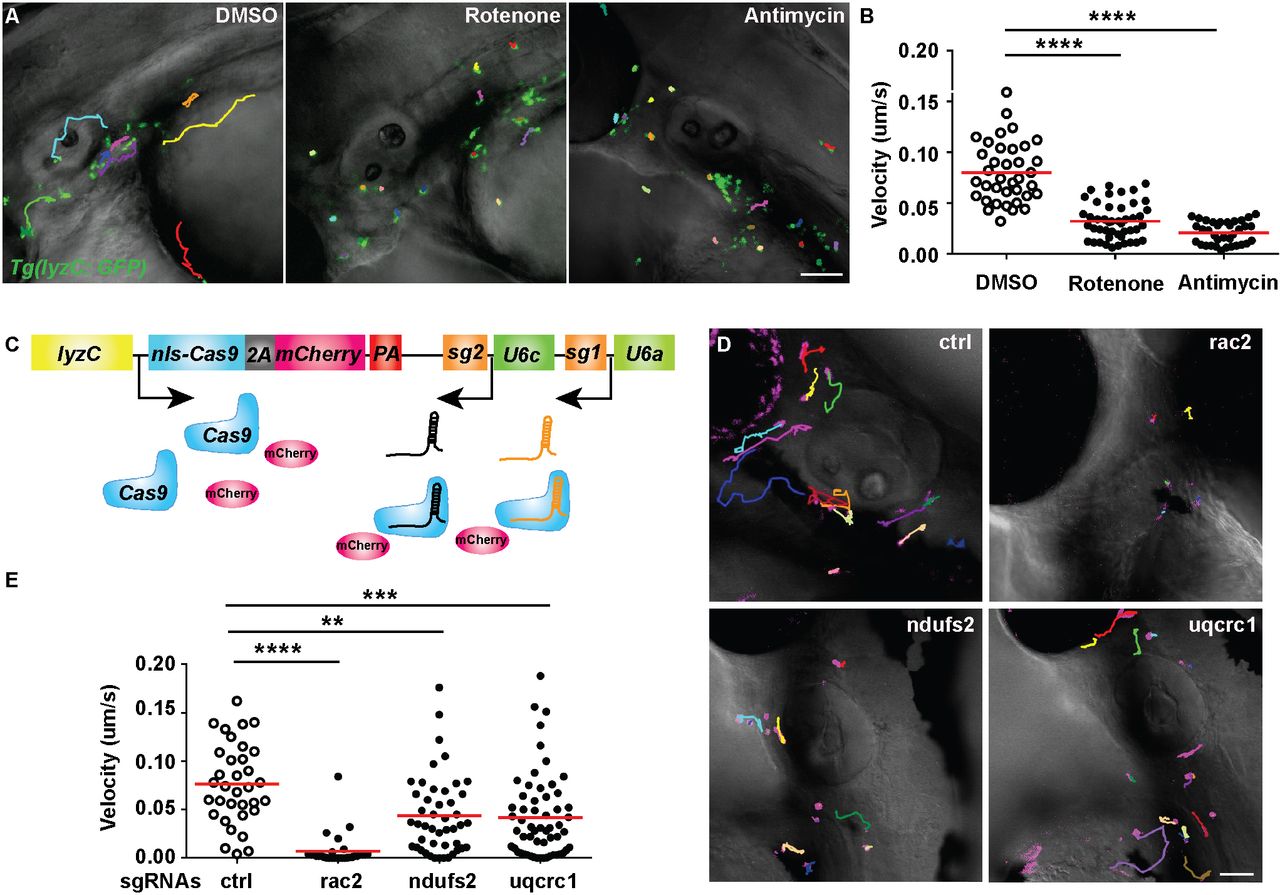
Fig. 3
Mitochondria complex I and III regulate neutrophil motility. (A,B) Tg(lyzC:GFP) at 3 dpf was treated with DMSO, rotenone or antimycin. Representative images (A) and quantification (B) of neutrophil motility in the head mesenchyme. One representative result from three biological repeats is shown. n=37 for DMSO, n=46 for rotenone and n=35 for antimycin from four different larvae. ****P<0.0001 by Kruskal–Wallis test. (C) Schematic of the vector used to produce two different sgRNAs. (D,E) Representative images (D) and quantification (E) of neutrophil motility in the head mesenchyme with neutrophil-specific transient knockout of rac2 (positive control), ndufs2 or uqcrc1. One representative result from three biological repeats is shown. n=34 for control (ctrl), and n=30 for rac2, n=46 for ndufs2 and n=58 for uqcrc1 knockouts from four different larvae. ****P<0.0001, ***P<0.001, **P<0.01 by Kruskal–Wallis test. Scale bars: 50 µm.