
- Title
-
TPC2-mediated Ca2+ signaling is required for the establishment of synchronized activity in developing zebrafish primary motor neurons.
- Authors
- Kelu, J.J., Webb, S.E., Galione, A., Miller, A.L.
- Source
- Full text @ Dev. Biol.
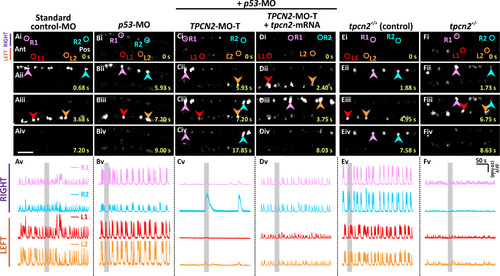
Effect of TPC2-knockdown, heterozygous-knockout, and mRNA rescue on the spontaneous Ca2+ activity of the CaPs in SAIGFF213A;UAS:GCaMP7a embryos at ~24 hpf. SAIGFF213A;UAS:GCaMP7a embryos were injected with: (A) Standard control-MO; (B) p53-MO; (C) TPCN2-MO-T with p53-MO; or (D) TPCN2-MO-T with p53-MO and the mutant tpcn2-mRNA. In addition, (E) untreated SAIGFF213A;UAS:GCaMP7a fish (termed tpcn2+/+ controls) were imaged and (F) they were crossed with homozygous tpcn2dhkz1a mutants to generate double-transgenic heterozygous mutants (tpcn2+/-). (Ai-Fiv) Time-lapse fluorescence images showing the changes in GCaMP7a fluorescence in the CaPs at different time intervals in the various treatment groups. The embryos are in a dorsal orientation and regions of interest (ROIs) on two (of the three) selected CaP cell bodies on the left (L) and right (R) sides of the spinal cord are shown. The arrowheads indicate GCaMP7a signals in the CaPs. Ant. and Pos. are anterior and posterior, respectively. Scale bar, 50 µm. (Av-Fv) Line graphs showing the ΔF/F0 against time (over a period of ~ 300 s) in the ROIs of the representative embryos shown in (Ai-Fiv), respectively. The time period that corresponds to the Ca2+ signaling events shown in the time-lapse fluorescence images (Ai-Fiv) is denoted by a grey vertical bar in (Av-Fv). Also see Movies S1-S3, which illustrate the distinct right/left alternation of Ca2+ transients in the controls and how this is disrupted when TPC2-mediated Ca2+ release was inhibited. |
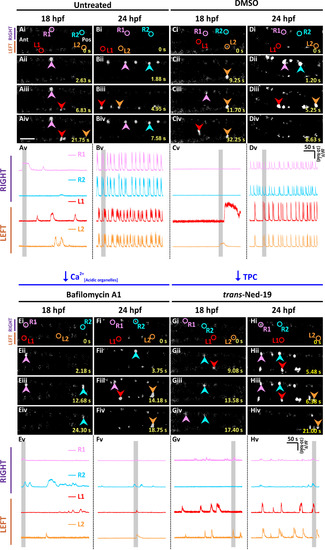
Effect of depleting the acidic Ca2+ stores and antagonizing TPCs on the spontaneous Ca2+ activity of the CaPs in SAIGFF213A;UAS:GCaMP7a embryos at ~18 hpf and ~24 hpf. Embryos were (A, B) untreated, or (C-H) they were treated with: (C,D) 1% DMSO, (E,F) 1 µM bafilomycin A1, or (G, H) 250 µM trans-ned-19. Drug treatments started at ~ 17 hpf, and finished at either (A,C,E,G) ~ 18 hpf or (B,D,F,H) ~ 24 hpf. (Ai-Hiv) Time-lapse fluorescence images, and (Av-Hv) line graphs as described in Fig. 1. EXPRESSION / LABELING:
PHENOTYPE:
|
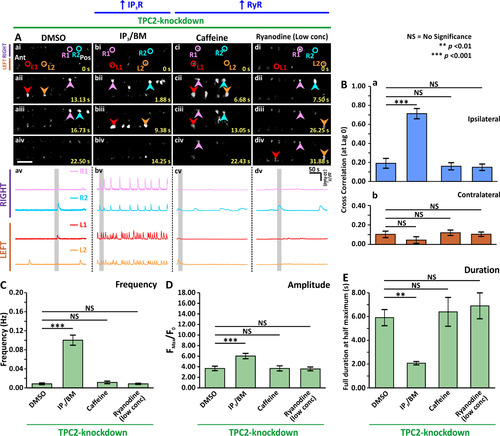
Effect of stimulating the ER-mediated Ca2+ release on the spontaneous Ca2+ activity of the CaPs in SAIGFF213A;UAS:GCaMP7a embryos at ~24 hpf after MO-based TPC2-knockdown. Embryos that had been injected with TPCN2-MO-T at the 1- to 4-cell stage to knockdown TPC2, were treated with: (Aa) 1% DMSO; (Ab) 100 µM IP3/BM; (Ac) 2 mM caffeine; or (Ad) 1 µM ryanodine at ~17 hpf. (Aai-Adiv) Time-lapse fluorescence images, and (Aav-Adv) line graphs as described in Fig. 1. (B) Bar graphs to show the mean± SEM cross correlation function at zero-lag of the (Ba) ipsilateral and (Bb) contralateral CaP Ca2+ activity. (C-E) Bar graphs to show the mean± SEM (C) frequency, (D) amplitude and (E) duration of the Ca2+ spikes in the CaPs of the embryos in the various treatment groups. Data were obtained from n = 30–90 cells from 5 to 10 embryos, except for the duration data, which were n = 6 cells from 3 embryos. p < 0.01 (**), and p < 0.001 (***), and NS indicates no significant difference between the data. |
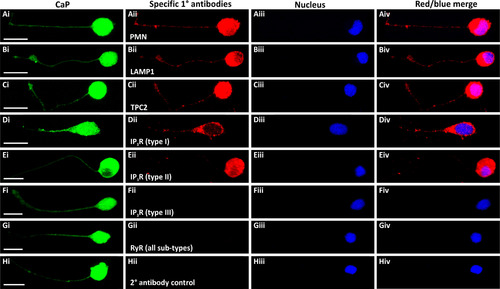
Expression and localization of LAMP1, TPC2, IP3Rs and RyRs in presumptive CaPs isolated from SAIGFF213A;UAS:GFP embryos and cultured for 24 h. The trunk of these embryos, which (Ai-Hi) express GFP in the CaPs, was dissected at ~18 hpf. The cells were dissociated and cultured for 24 h and then they were immunolabelled with antibodies for: (Aii) PMNs, (Bii) lysosomal-associated membrane protein 1 (LAMP1), (Cii) TPC2, (Dii-Fii) IP3R types I-III, respectively, or (Gii) RyR (all sub-types). Panel (Hii) shows a secondary antibody control. (Aiii-Hiii) The cells were co-stained with DAPI to label the nuclei. Each panel is a series of optical sections that have been projected as a single confocal image, and they show: (Ai-Hi) GFP in the presumptive CaPs (in green); (Aii-Hii) the localization of the various proteins immunolabelled (in red); (Aiii-Hiii) the DAPI-labeled nuclei (in blue); and (Aiv-Hiv) images showing the red and blue channels when merged. Scale bars, 10 µm. (For interpretation of the references to color in this figure legend, the reader is referred to the web version of this article) |
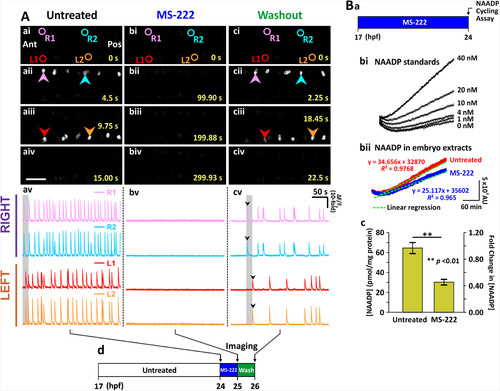
Effect of inhibiting the action potentials on the spontaneous Ca2+ activity of the CaP in SAIGFF213A;UAS:GCaMP7a embryos, and on the production of NAADP by AB wild-type embryos, at ~24 hpf. SAIGFF213A;UAS:GCaMP7a embryos were (Aa) imaged at ~24 hpf. (Ab) MS-222 was then applied for 1 h and the embryos were imaged again (i.e., at ~ 25 hpf). (Ac) Subsequently, the MS-222-treated embryos were washed with Danieau’s solution for 1 h, after which they were imaged one more time (i.e., at ~26 hpf). (Aai-Aciv) Time-lapse fluorescence images, and (Aav-Acv) line graphs as described in Fig. 1. The data presented in panels Aa-Ac were collected from the same representative embryo. (Ad) Schematic to show the timing of the MS-222 treatment and washout experiments. (B) The NAADP cycling assay was used to detect the endogenous level of NAADP in embryos at ~24 hpf. (Ba) Schematic to show the timing of the MS-222 treatment. (Bb) Line graphs show the change in the fluorescence intensity of resofurin over time (covering a period of ~ 270 min) such that (Bbi) shows NAADP standards of 0–40 nM, and (Bbii) shows NAADP measured in samples prepared from intact embryos at ~24 hpf in the absence/ presence of MS-222. These plots were then fitted into linear regression models, and the slope (m) of fluorescence increase was determined by y = mx+c. (Bc) Bar graph showing the normalized [NAADP], and the corresponding fold-change of [NAADP] in the samples prepared from embryos± MS-222 (n = 9 from 3 independent assays). p < 0.01 (**). |
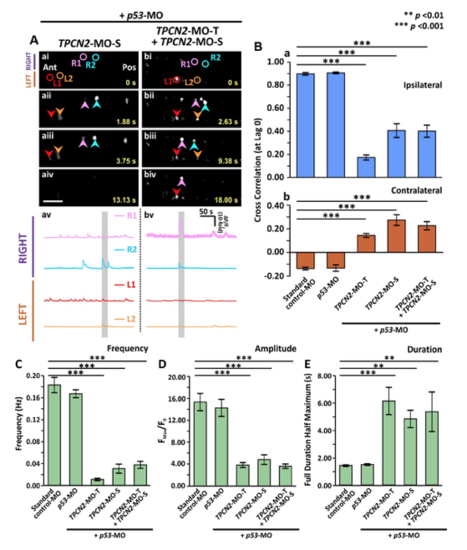
Effect of MO-based knockdown of TPC2 (via injection of either TPC2-MO-S or TPC2-MO-S and TPC2-MO-T) on the spontaneous Ca2+ activity of CaPs in SAIGFF213A;UAS:GCaMP7a double-transgenic embryos at ~24 hpf. SAIGFF213A;UAS:GCaMP7a embryos were injected with: (Aa) TPCN2-MO-S with p53-MO; or (Ab) TPCN2-MO-T and TPC2-MO-S with p53-MO. (Aai-Abiv) Time-lapse fluorescence images showing the changes in GCaMP7a fluorescence in the CaPs at different time intervals in the two treatment groups. The embryos are in a dorsal orientation and regions of interest (ROIs) on two selected CaP cell bodies on the left (L) and right (R) sides of the spinal cord are shown. The arrowheads indicate GCaMP7a signals in the CaPs. Ant. and Pos. are anterior and posterior, respectively. Scale bar is 50 µm. (Aav,Abv) Line graphs to show the ΔF/F0 against time (over a period of ~300 sec) in the ROIs of the representative embryos shown in (Aai-Abiv), respectively. The time period that corresponds to the Ca2+ signaling events shown in the time-lapse fluorescence images (Aai-Abiv) is denoted by a grey vertical bar in (Aav-Abvi). (B) Bar graphs to show the mean ± SEM cross correlation function at zero lag of the (Ba) ipsilateral, and (Bb) contralateral CaP Ca2+ activity. (C-E) Bar graphs to show the mean ± SEM (C) frequency, (D) amplitude and (E) duration of the Ca2+ spikes in the CaPs of the double-transgenic embryos in the various treatment groups. Data were obtained from n=24-63 cells from 4-7 embryos, except for the duration data, which were n=6 cells from 3 embryos. p<0.01 (**) and p<0.001 (***), and NS indicates no significant difference between the data. |
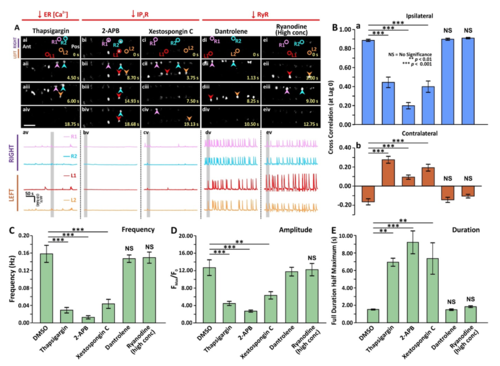
Effect of thapsigargin, 2-APB, xestospongin C, dantrolene or ryanodine (at a high concentration) on the spontaneous Ca2+ activity of CaPs in SAIGFF213A;UAS:GCaMP7a double-transgenic embryos. SAIGFF213A;UAS:GCaMP7a embryos were treated with: (Aa) 1 µM thapsigargin; (Ab) 10 µM 2-APB; (Ac) 1 µM xestospongin C; (Ad) 50 µM dantrolene, or (Ae) 50 µM ryanodine at 17 hpf via tail-bud excision. (Aai-Aeiv) Time-lapse fluorescence images showing the changes of GCaMP7a fluorescence signals in the CaPs at different time intervals in the various treatment groups. The embryos are in a dorsal orientation and ROIs on two selected CaP cell bodies on the left (L) and right (R) sides of the spinal cord are shown. The arrowheads indicate the increase in GCaMP7a signals in the CaPs. Ant. and Pos. are anterior and posterior, respectively. Scale bar is 50 µm. (Aav-Aev) Line graphs to show the ΔF/F0 against time (over a period of ~300 sec) in the ROIs of the representative embryos shown in (Aai-Aeiv), respectively. The time period that corresponds to the Ca2+ signaling events shown in the time-lapse fluorescence images (Aai-Aeiv) is denoted by a grey vertical bar in (Aav-Aevi). (B) Bar graphs to show the mean ± SEM cross correlation at zerolag of the (Ba) ipsilateral, and (Bb) contralateral CaP Ca2+ activity. (C-E) Bar graphs to show the mean ± SEM (C) frequency, (D) amplitude and (E) duration of the Ca2+ spikes in the CaPs of the double-transgenic embryos in the various treatment groups. Data were obtained from n=18-81 cells from 3-9 embryos, except for the duration data, which were n=6 cells from 3 embryos. p<0.01 (**) and p<0.001 (***), and NS indicates no significant difference between the data. |
Reprinted from Developmental Biology, 438(1), Kelu, J.J., Webb, S.E., Galione, A., Miller, A.L., TPC2-mediated Ca2+ signaling is required for the establishment of synchronized activity in developing zebrafish primary motor neurons., 57-68, Copyright (2018) with permission from Elsevier. Full text @ Dev. Biol.