
- Title
-
Modeling Environmentally-Induced Motor Neuron Degeneration in Zebrafish
- Authors
- Morrice, J.R., Gregory-Evans, C.Y., Shaw, C.A.
- Source
- Full text @ Sci. Rep.

ZFIN is incorporating published figure images and captions as part of an ongoing project. Figures from some publications have not yet been curated, or are not available for display because of copyright restrictions. PHENOTYPE:
|
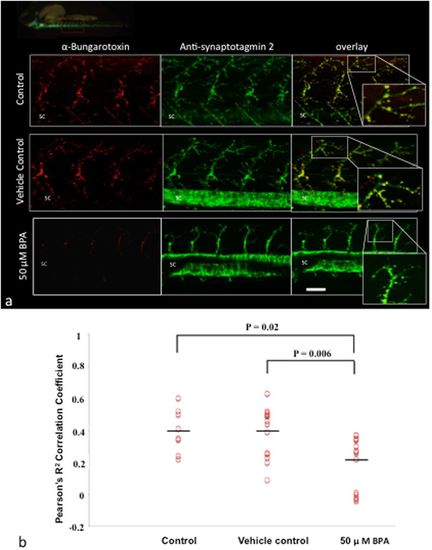
BPA exposure impairs NMJ integrity. (a) Representative images of α-bungarotoxin (post-synaptic terminal) and synpatotagmin 2 (pre-synaptic terminal) labeling in wild type embryos at 48 hpf exposed to BPA vehicle control, or control media. Inset magnifications are merged images of the pre- and post-synaptic terminals. SC, spinal cord. (b) Data are based on the integrity of the NMJ at 48 hpf in control, vehicle control and BPA exposed embryos as measured by Pearson’s R2 co-localization coefficient between α-bungarotoxin and synaptotagmin 2. P = 0.02, N = 8–15 biological replicates; P = 0.006, N = 15 biological replicates; N = 5–6 technical replicates of motor neurons. P values were determined by Mann-Whitney U test. PHENOTYPE:
|
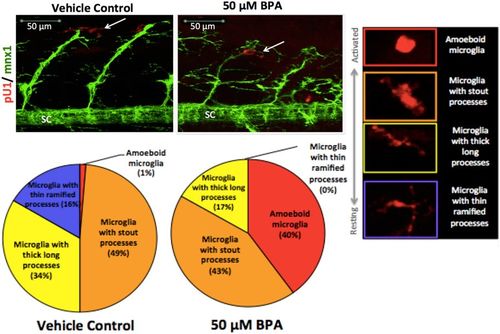
Activated microglia associate with defective motor neurons. Double transgenic Tg:mnx1-GFP/pU1-RFP embryos identify microglia (red) and motor neurons (green). White arrows point to pU1+ microglial cells spatially associated with motor neurons at 48 hpf. Percent values in the pie charts show the relative proportion of total microglia in each activation state compared to total number of microglia cells in region of interest (right panel) when exposed to BPA compared to vehicle controls (N = 9–12 biological replicates; N = 1–10 technical replicates). SC = spinal cord. PHENOTYPE:
|
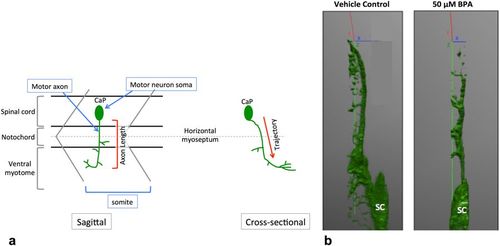
Motor neuron trajectory from a sagittal and cross sectional view. At 18 hpf, primary motor neurons start to exit the ventral root of the spinal cord. By 48 hpf each somite has one set of caudal (CaP), middle (MiP) and rostral (RoP) primary motor neurons innervating each side of the spinal segment67. For simplicity, here we only show the CaP motor neuron. (a) CaP motor axons project ventrally from the SC to the ventral myotome. Axon length is conventionally measured from the sagittal plane, with the assumption that motor axons in control embryos and embryos with motor axon abnormalities follow the same trajectory. (b) Defective motor axons have a normal trajectory from the spinal cord. Tg:mnx1-GFP embryos exposed to BPA have a similar motor axonal trajectory through the Z axis (green) as vehicle controls (N = 3 biological replicates). |
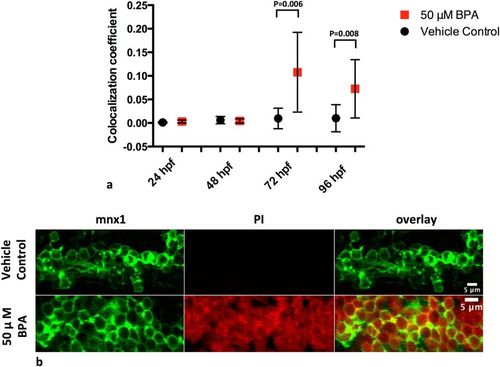
BPA exposure causes increased motor cell death at 72 hpf. (a) Motor neuron cell death is increased in the spinal cord starting at 72 hpf following BPA exposure as compared to vehicle controls. Values indicate colocalization coefficients between cells with a positive signal for both mnx1-GFP and PI in the spinal cord, indicating dead motor neurons. Group values between time points should be interpreted independently due to non-uniform PI staining between time points. (b) BPA-exposed embryos show colocalization between PI + cells and mnx1 motor neuron soma 96 hpf, and show that PI staining is not specific to mnx1 motor neuron soma. Data represent the mean ± s.d.; N = 7–12 biological replicates. P values were determined by Mann-Whitney U test. PHENOTYPE:
|
|
ZFIN is incorporating published figure images and captions as part of an ongoing project. Figures from some publications have not yet been curated, or are not available for display because of copyright restrictions. PHENOTYPE:
|
|
ZFIN is incorporating published figure images and captions as part of an ongoing project. Figures from some publications have not yet been curated, or are not available for display because of copyright restrictions. PHENOTYPE:
|
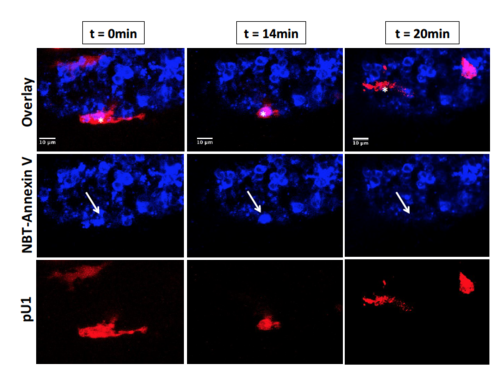
Microglial engulfment of apoptotic neurons at 72 hpf. Representative static images from live imaging of a microglial cell engulfing an apoptotic neuron in the spinal cord at 72 hpf following BPA exposure in a double transgenic Tg:pU1:Gal4-UAS-RFP/NBT:DLexPR-secA5-TagBFP embryo, which have pU1+ microglia cells labeled in red and apoptotic neurons labeled in blue. Asterisks denotes pU1+ cell (in red) in the process of engulfing a neuron undergoing apoptosis (in blue) in the spinal cord and its subsequent migration away from this site. White arrow denotes an apoptotic neuron being removed from the spinal cord over a time course of 20 minutes. Note that specific microglia were not followed from 48 hpf to 72 hpf, and cells imaged in this figure illustrate the general microglial response in the spinal cord at 72 hpf. Images were collected from N = 1 biological replicate. |
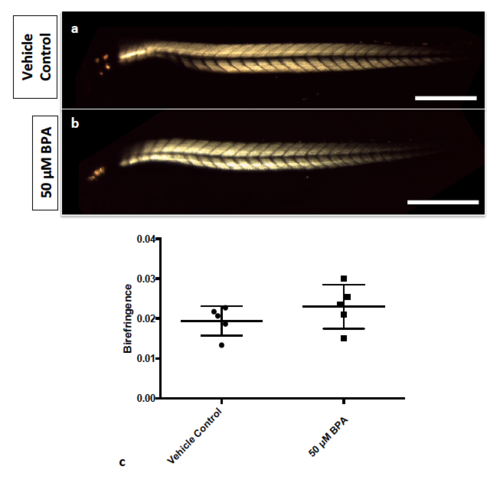
Quantification of muscle birefringence (a-b) Birefringence of skeletal muscle at 48 hpf in wild type embryos exposed to vehicle control or BPA at 6 hpf. c) Wild type embryos exposed to vehicle control or 50 μM BPA had similar skeletal muscle birefringence at 48 hpf (P=0.27; N=5 biological replicates, N=1 technical replicate). Birefringence values represent the mean intensity of the total trunk normalized to the area of trunk analyzed. Scale bar = 500 μm. Data was analyzed by students t-test using Welch’s correction. PHENOTYPE:
|
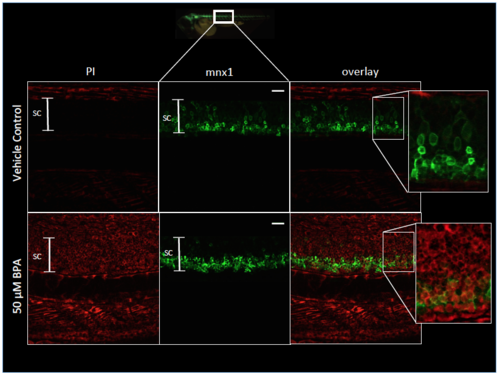
Cell death caused by BPA is not specific to motor neurons. Representative images of non-specific cell death following BPA exposure. PI staining in spinal cord and musculature of embryos exposed to 50 μM BPA or vehicle control. Images represent one hemisegment within the 6 – 9 somite region of Tg:mnx1- GFP embryos at 3dpf. Inset images show that the neurotoxic effect of BPA is not motor neuron-specific in the spinal cord. Spinal cord (SC) is indicated by the white capped bar. Scale bar = 20 μm. PHENOTYPE:
|
|
ZFIN is incorporating published figure images and captions as part of an ongoing project. Figures from some publications have not yet been curated, or are not available for display because of copyright restrictions. PHENOTYPE:
|
|
ZFIN is incorporating published figure images and captions as part of an ongoing project. Figures from some publications have not yet been curated, or are not available for display because of copyright restrictions. PHENOTYPE:
|