
- Title
-
Genetic analysis of zebrafish homologs of human FOXQ1, foxq1a and foxq1b, in innate immune cell development and bacterial host response
- Authors
- Earley, A.M., Dixon, C.T., Shiau, C.E.
- Source
- Full text @ PLoS One
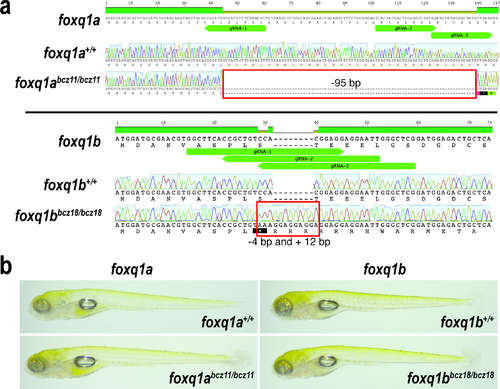
Sequence analysis of foxq1abcz11 and foxq1bbcz18 mutations generated by CRISPR-Cas9 targeting. a Top, DNA and amino acid sequences of the 5’ end of foxq1a coding region. DNA sequencing chromatograms show the expected foxq1a sequence in the wildtype sibling, and a large 95 base pair deletion (red box) in the homozygous bcz11 mutant, which causes a premature stop (black box with an asterisk) at the beginning of the gene. Bottom, DNA and amino acid sequences of the 5’ end of foxq1b coding region. DNA chromatograms show wildtype sequence in foxq1b wildtype sibling, while the homozygous bcz18 mutant carries a 4 bp deletion and 12 bp insertion (red box) causing a nonsense mutation at the beginning of the gene. gRNA, target sites of the guide RNAs used. b Whole mount live imaging of 5 dpf larvae show normal gross morphological development of foxq1abcz11 and foxq1bbcz18 mutants as compared to wildtype siblings (at least 10 animals were analyzed per genotype group). PHENOTYPE:
|

Gene expression analysis of foxq1a and foxq1b. a Isolation of macrophages based on GFP expression by FACS in mpeg1:EGFP transgenic zebrafish embryos at 2.5 dpf. Non-fluorescent embryos were used as a negative control for gating. Top left, P4 shows the cell fraction sorted as GFP+ macrophages, also shown in the right panels in brightfield and green channel. b RT-PCR analysis of gene markers validated the different cell populations sorted by FACS, as denoted by E, erythrocytes; M, macrophages; A, all remaining non-fluorescent cells. The following genes were used: translation elongation factor 1 (ef1a) as a reference marker, hemoglobin beta embryonic-1.1 (hbbe1.1) as an erythrocyte marker, and macrophage expressed gene 1 (mpeg1) and interferon regulatory factor 8 (irf8) as well-established macrophage markers in zebrafish. As expected, the ‘A’ cells expressed all genes, while erythrocytes ‘E’ cells expressed hbbe1.1, ef1a, and DsRed genes and macrophage ‘M’ cells expressed macrophage markers, GFP, and ef1a. c Using the sorted cell populations, we found expression of foxq1a in macrophages and neither gene in erythrocytes. Both genes are expressed at 2 to 8 dpf of development as well as in the adult gut tissue. |
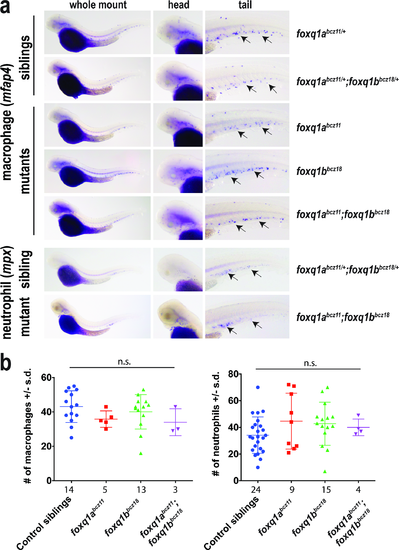
Single and double foxq1abcz11 and foxq1bbcz18 mutants have normal macrophage and neutrophil development. a Whole mount in situ hybridization of 2.5 dpf single and double foxq1abcz11 and foxq1bbcz18 mutants and their siblings using RNA probes for mfap4 (macrophage marker) and mpx (neutrophil marker). Arrows, macrophages or neutrophils in the caudal hematopoietic tissue in the embryo tail. b Scatter plots showing number of macrophages and neutrophils in the tail region for each embryo quantified in the different genotype categories. n, number of embryos analyzed beneath each scatter plot. Plots report average ± standard deviation (s.d.). Multiple unpaired t-tests comparing between control siblings and each of the mutants groups were conducted with correction for multiple comparisons using the Sidak-Bonferroni method and without assuming equal variance to determine statistical significance. n.s., no statistical significance as defined by p > 0.05 was found in all the comparisons. |
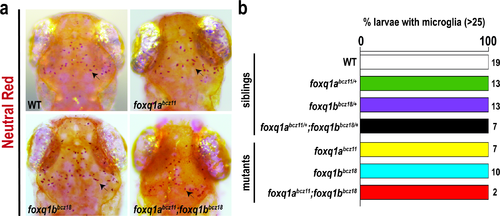
Neutral red analysis shows normal microglia development in single and double foxq1a and foxq1b mutants at 4 dpf. a Neutral red staining in 4 dpf wildtype (WT) sibling, foxq1abcz11, foxq1bbcz18, and foxq1abcz11;foxq1bbcz18 mutants shows a stereotypical pattern of microglia in the midbrain (arrow). b Bar graph shows all larvae analyzed in all genotype groups had normal numbers of microglia (>25). Number of larvae analyzed (n) shown to the right of the corresponding bar. PHENOTYPE:
|
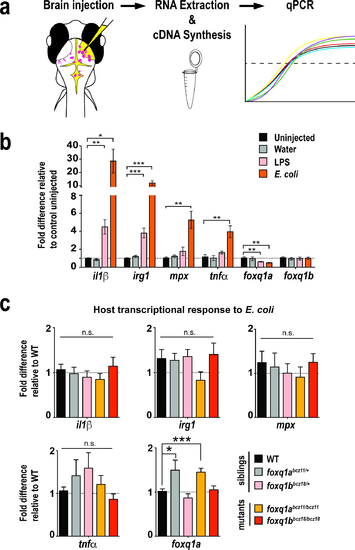
foxq1abcz11 and foxq1bbcz18 mutants exhibit wildtype transcriptional response to E. coli challenge in the larval brain. a Graphical representation of the brain challenge assay. E. coli was injected into right brain tectum, and at 6 hours post injection (hpi), injected larvae were individually processed for RNA extraction, genotyping, cDNA synthesis, and qPCR analysis. b Bar chart shows significant upregulation of immune activation genes il1β, irg1, mpx, and tnfα after bacteria challenge at 6 hpi in wildtype larvae compared with uninjected controls. Water injected wildtype larvae exhibit no induction of activation genes, whereas LPS injected wildtype animals have a significant upregulation of il1β and irg1. After microbial activation by E. coli or LPS, a significant downregulation of foxq1a was found by about a factor of 2. No significant change was found for foxq1b after immune challenge. Data from wildtype injections validate the efficacy of the assay to activate the innate immune system. Dotted line marks no fold difference at 1. At least 6 or more independent biological samples were measured per category. c Bar plot shows transcriptional changes of target genes after E. coli injection in the brain at 6 hpi for control siblings and foxq1a and foxq1b mutants. n = 9–14 independent biological samples were measured per genotype. All error bars show standard error of means. Statistical significance in b and c was determined by multiple unpaired t-tests comparing between uninjected or sibling controls and the experimental groups with correction for multiple comparisons using the Sidak-Bonferroni method and without assuming equal variance. n.s., no statistical significance as defined by p > 0.05. *, p < 0.05; **, p < 0.01; ***, p < 0.001. PHENOTYPE:
|
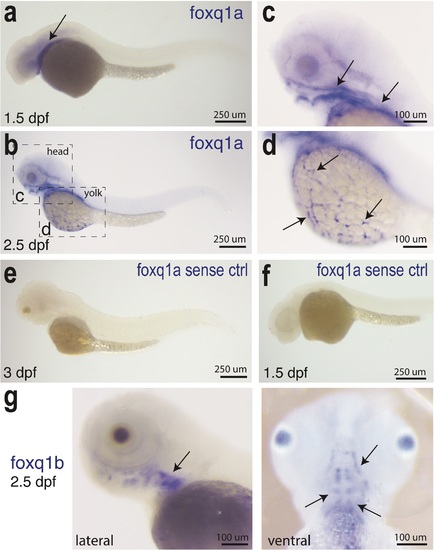
RNA expression pattern of foxq1a and foxq1b in zebrafish embryos. a-dfoxq1a gene expression. a Expression in ventral head region is found in 1.5 dpf embryo (arrow). b Prominent expression at 2.5 dpf in the craniofacial region (arrows, higher magnification in c), on the yolk (arrows, higher magnification in d), and along the body abutting the yolk. Yolk expression is not found in all embryos analyzed whereas the craniofacial expression is. e-f As a negative control, whole mount in situ hybridization using the sense RNA probe for foxq1a does not show any expression at all stages analyzed from 1–3 dpf. g foxq1b expression is prominent in the craniofacial jaw region. Left, lateral view (arrow). Right, ventral view (arrows). |