
|
Fig. 2
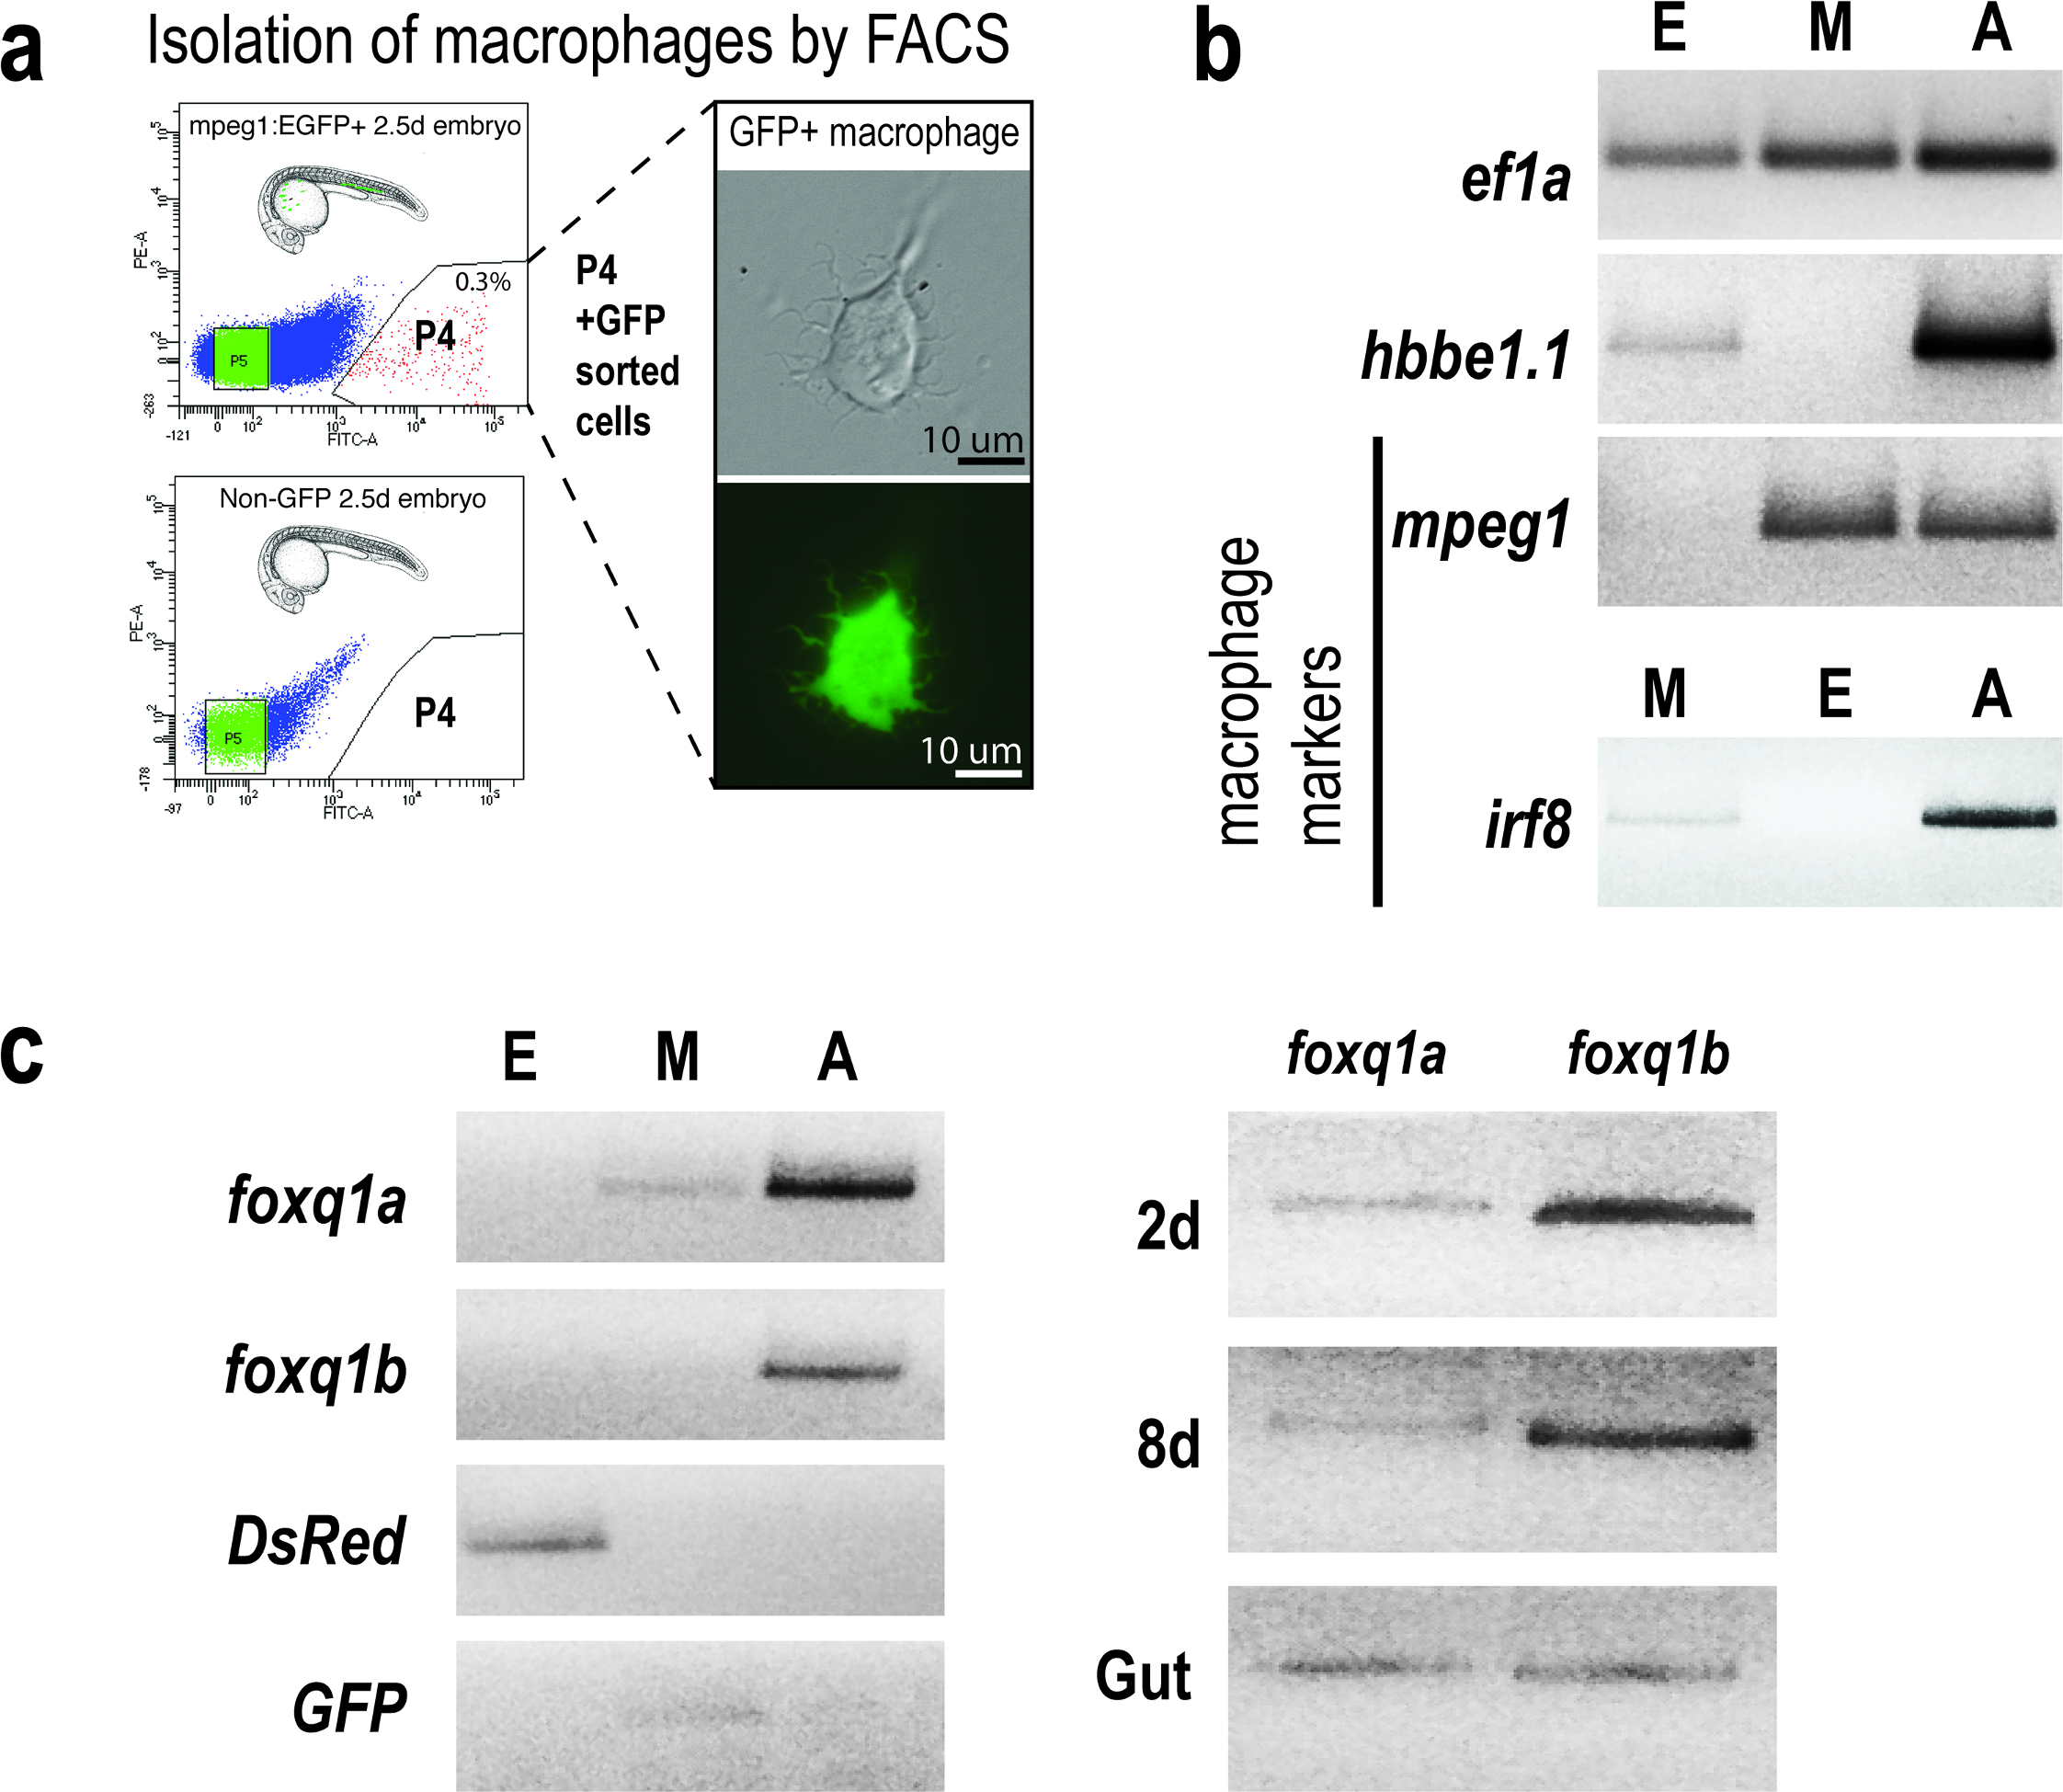
Gene expression analysis of foxq1a and foxq1b.
a Isolation of macrophages based on GFP expression by FACS in mpeg1:EGFP transgenic zebrafish embryos at 2.5 dpf. Non-fluorescent embryos were used as a negative control for gating. Top left, P4 shows the cell fraction sorted as GFP+ macrophages, also shown in the right panels in brightfield and green channel. b RT-PCR analysis of gene markers validated the different cell populations sorted by FACS, as denoted by E, erythrocytes; M, macrophages; A, all remaining non-fluorescent cells. The following genes were used: translation elongation factor 1 (ef1a) as a reference marker, hemoglobin beta embryonic-1.1 (hbbe1.1) as an erythrocyte marker, and macrophage expressed gene 1 (mpeg1) and interferon regulatory factor 8 (irf8) as well-established macrophage markers in zebrafish. As expected, the ‘A’ cells expressed all genes, while erythrocytes ‘E’ cells expressed hbbe1.1, ef1a, and DsRed genes and macrophage ‘M’ cells expressed macrophage markers, GFP, and ef1a. c Using the sorted cell populations, we found expression of foxq1a in macrophages and neither gene in erythrocytes. Both genes are expressed at 2 to 8 dpf of development as well as in the adult gut tissue.