
FIGURE
Fig. 4
- ID
- ZDB-FIG-180625-10
- Publication
- Earley et al., 2018 - Genetic analysis of zebrafish homologs of human FOXQ1, foxq1a and foxq1b, in innate immune cell development and bacterial host response
- Other Figures
- All Figure Page
- Back to All Figure Page
Fig. 4
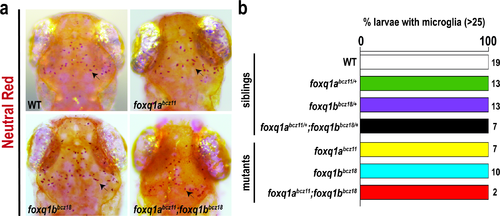
Neutral red analysis shows normal microglia development in single and double foxq1a and foxq1b mutants at 4 dpf. a Neutral red staining in 4 dpf wildtype (WT) sibling, foxq1abcz11, foxq1bbcz18, and foxq1abcz11;foxq1bbcz18 mutants shows a stereotypical pattern of microglia in the midbrain (arrow). b Bar graph shows all larvae analyzed in all genotype groups had normal numbers of microglia (>25). Number of larvae analyzed (n) shown to the right of the corresponding bar. |
Expression Data
Expression Detail
Antibody Labeling
Phenotype Data
| Fish: | |
|---|---|
| Observed In: | |
| Stage: | Day 4 |
Phenotype Detail
Acknowledgments
This image is the copyrighted work of the attributed author or publisher, and
ZFIN has permission only to display this image to its users.
Additional permissions should be obtained from the applicable author or publisher of the image.
Full text @ PLoS One