
- Title
-
AHR2 required for normal behavioral responses and proper development of the skeletal and reproductive systems in zebrafish
- Authors
- Garcia, G.R., Bugel, S.M., Truong, L., Spagnoli, S., Tanguay, R.L.
- Source
- Full text @ PLoS One

ahr2osu1 mutants are resistant to TCDD-induced developmental toxicity. (A) Lateral view of representative bright field images of 5 dpf ahr2+ and ahr2osu1 zebrafish developmentally exposed to embryo medium (EM), 0.1% DMSO, or 1 ng/mL TCDD. J = jaw, E = eye, PE = pericardial edema, and YE = yolk sac edema. Black bar in bottom right corner = 100 μm. (B) A 5 dpf zebrafish embryo-larval developmental toxicity assay for ahr2+ and ahr2osu1 mutants developmentally exposed to DMSO or TCDD (n = 32). The wild-type embryos exposed to TCDD exhibited significant malformations for 11 endpoints examined, including yolk sac and pericardial edema, and craniofacial malformations. No significant malformations were observed in the AHR2-null zebrafish exposed to TCDD. Morphological evaluations were completed in a binary notation (present/absent) and statistically compared using Fisher’s exact test at p < 0.05 for each endpoint. PHENOTYPE:
|

ZFIN is incorporating published figure images and captions as part of an ongoing project. Figures from some publications have not yet been curated, or are not available for display because of copyright restrictions. |
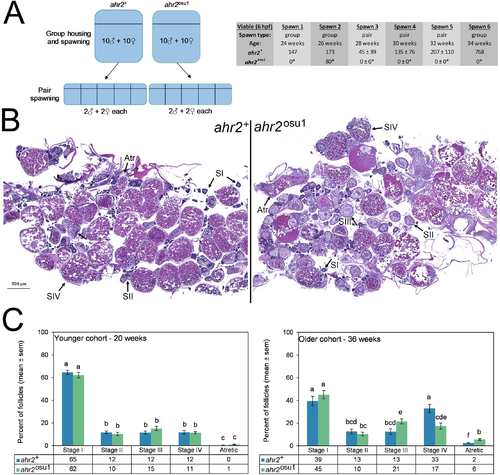
Reproductive impacts on the ovary are evident in ahr2osu1 zebrafish. (A) A fecundity study was performed with group and pair spawning between weeks 24 and 34 with age-matched cohorts of ahr2+ and ahr2osu1 zebrafish. Weeks 24–34 correspond to the optimal reproductive period. Between spawns, pairs were re-combined into groups so that each pair spawn were randomly selected groups. *p < 0.05 for group spawning (Fisher’s exact test) or pair-wise spawning (Student’s t-test) when compared to wild type. For group spawns, n = 10 males, 10 females. For pair spawns, n = 5, each with 2 males and 2 females. (B) Ovarian histopathological assessments were performed on ahr2+ and ahr2osu1 zebrafish to quantify the representative follicle distribution. Photomicrographs for the older cohort (36 weeks) are shown for each genotype using the sections most representative of group averages. (C) Differential follicle analysis was performed for reproductively active adult zebrafish at 20 and 36 weeks (n = 4 per genotype for each age group). Statistical differences between genotypes and developmental stages were determined using two-way ANOVA with Tukey post hoc test for multiple comparisons (p < 0.05). Significance is indicated using compact letter display, and bars not in the same letter group are significantly different. Follicles were scored as Stage I (pre-vitellogenic primary growth), Stage II (early-vitellogenic cortical alveolus stage), Stage III (mid-vitellogenic), Stage IV (late-vitellogenic mature), and atretic. PHENOTYPE:
|

Fin and skeletal abnormalities observed in adult ahr2osu1 line. Wild types and AHR2-null zebrafish were developmentally exposed at 6 hpf to EM, 0.1% DMSO, or 1 ng/mL TCDD, and the cartilage was stained and measured at 5 dpf. (A) A morphometric system was used to measure the position and length of landmark structures in the developing jaw. The position of jaw structures representing junctions between Meckel’s and palatoquadrate cartilages (points A and B) and the hyosymplectic and ceratohyal cartilages (points C and D) was measured relative to a reference point as shown. Statistical significance was determined by a modified two-way ANOVA with a Tukey post hoc test. Morphometric values represent mean ± SD (n = 9–10; p < 0.05 = * or #, p < 0.01 = ** or ##, p < 0.001 = ***). The asterisk (*) indicates statistical significance in wild-type fish exposed to TCDD compared to wild-type fish exposed to DMSO, and (#) indicates statistical significance in DMSO-exposed ahr2osu1 mutants compared to DMSO-exposed wild-type fish. (B) Representative ventral views of 5 dpf cartilage in wild types and AHR2-null mutants developmentally exposed to EM, 0.1% DMSO, or 1 ng/mL TCDD. Black bar in bottom right corner = 100 μm. (C) Representative brightfield images of adult wild types’ and ahr2osu1 mutants’ heads and caudal fins. Dark blue square represents area in panels below. Black bar in top left corner = 3.0 mm. (D) microCT imaging of adult wild-type (female) and ahr2osu1 mutant female and male zebrafish heads. Male and female wild-type microCT scans looked the same and a representative female image was selected as the representative image. Notable differences were observed in the dentate (d), supraorbital (so), frontal (fr), infraorbital (inf), and operculum (op). Black bar in top right corner = 3.0 mm. |
|
ZFIN is incorporating published figure images and captions as part of an ongoing project. Figures from some publications have not yet been curated, or are not available for display because of copyright restrictions. |