
- Title
-
A Massively Parallel Reporter Assay of 3' UTR Sequences Identifies In Vivo Rules for mRNA Degradation
- Authors
- Rabani, M., Pieper, L., Chew, G.L., Schier, A.F.
- Source
- Full text @ Mol. Cell
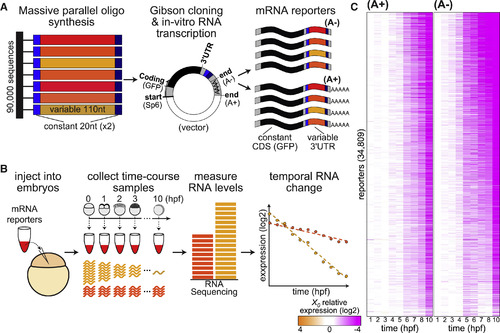
An MPRA Survey of 3′ UTR-Mediated Dynamic mRNA Decay (A) In vitro-synthesized DNA fragments (left) of zebrafish3′ UTR sequences (110 nt, red and orange) with two flanking terminal adaptors (20 nt, gray) were cloned into the 3′ UTR of a GFP reporter (center), and in vitro-transcribed to generate mRNA reporters (right) with different 3′ UTR sequences (red and orange). Two reporter pools contained either non-adenylated reporters (A−, top) or pre-adenylated reporters (A+, bottom). (B) mRNA reporters were microinjected into 1-cell staged zebrafish embryos (left), and hourly RNA samples were collected for the first 10 hr of development (center). Stable mRNAs maintain a similar level in all samples (dark orange), whereas levels of unstable mRNAs decrease over time (light orange). Temporal samples were sequenced and normalized to internal spike-ins to generate a decay profile for each reporter (left). (C) Temporal (columns; hours post fertilization) mRNA abundance (white, X0; orange, 16-fold above X0; purple, 16-fold below X0; log2 scale) of 34,809 reporters (rows, sorted by their predicted onset times and half-life) that were measured with at least a minimal average coverage in both A+ (left) and A− (right) samples. See also Figures S1–S3 and Tables S1, S2, and S3. |
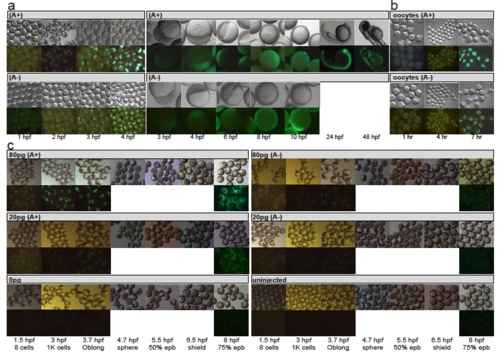
Development of zebrafish embryos after injection of mRNA reporters. Related to Figure 1. Images of zebrafish embryos or oocytes at different developmental stages (columns; developmental times as indicated on bottom) after they were injected with mRNA reporters at the 1-cell stage. Top panels show an image of the developmental stage, and lower panels show GFP florescence (green) that arise from translation of the mRNA reporters in those embryos. (a) Embryos injected with A+ (top) or A- (bottom) reporters. (b) Oocytes injected with A+ (top) or A- (bottom) reporters. (c) Embryos injected with 80pg, 20pg or 0pg of A+ (left) or A- (right) reporters and uninjected controls. |