
|
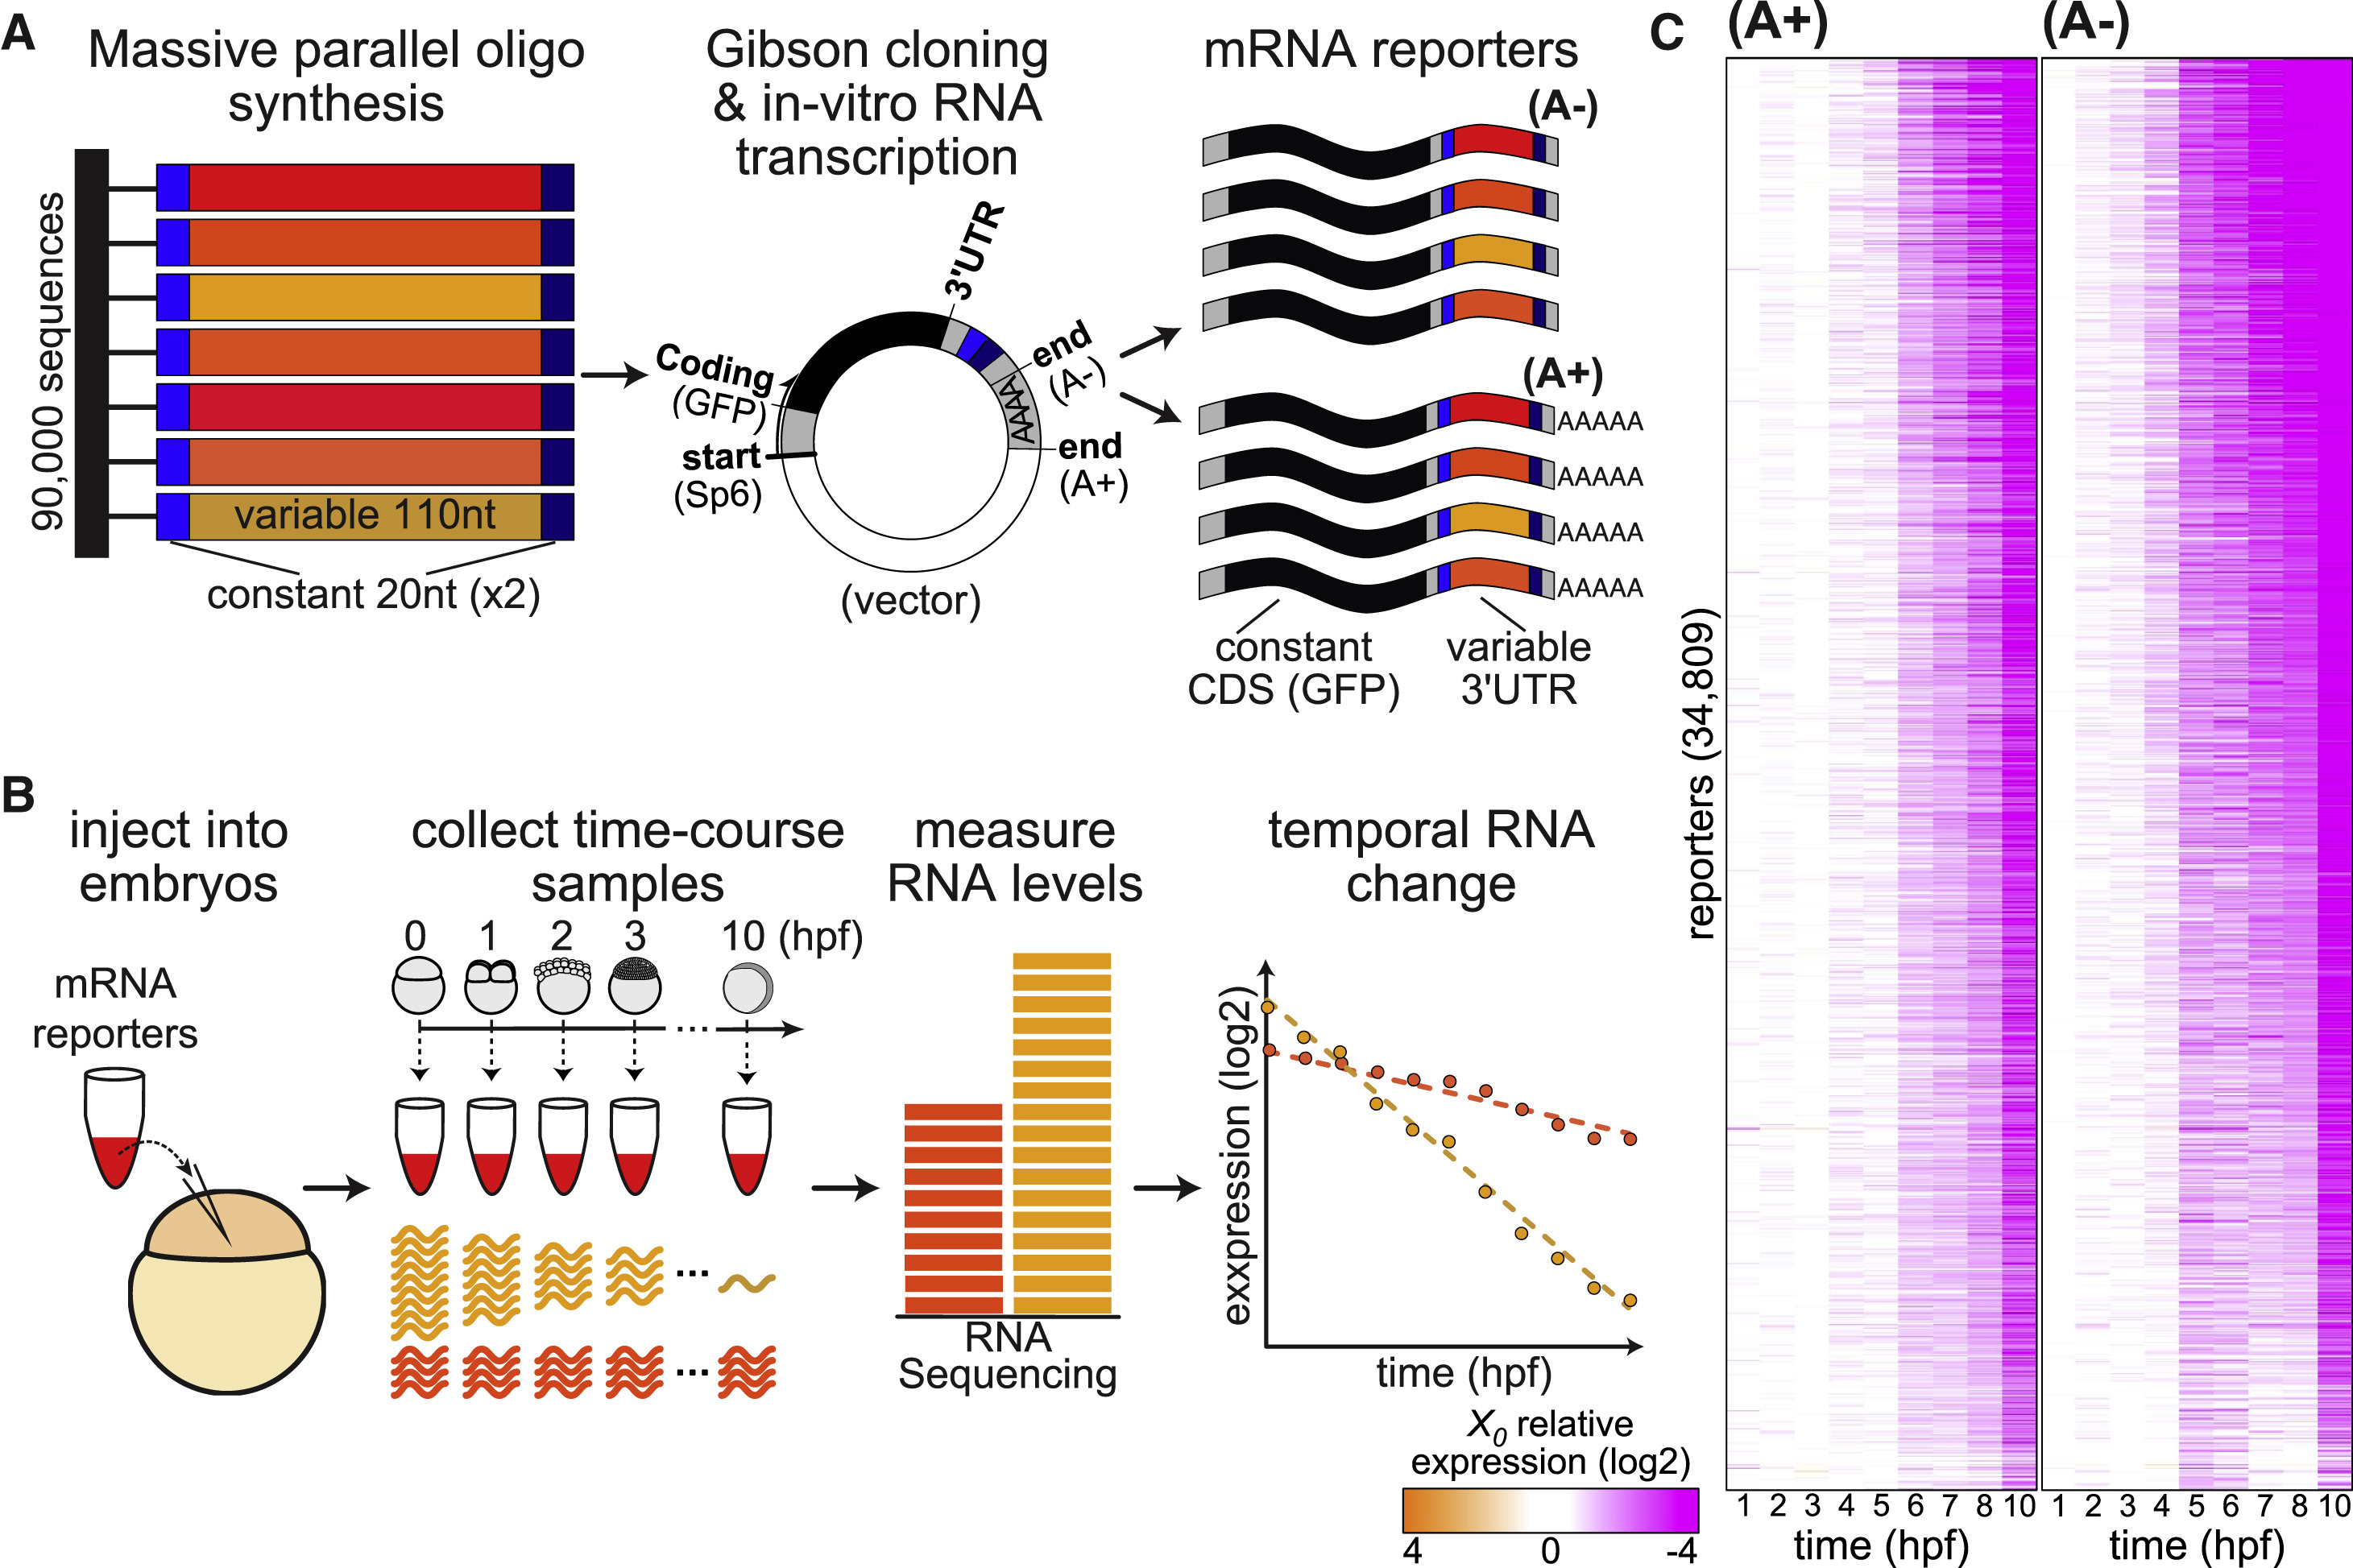
Fig. 1
An MPRA Survey of 3′ UTR-Mediated Dynamic mRNA Decay
(A) In vitro-synthesized DNA fragments (left) of zebrafish3′ UTR sequences (110 nt, red and orange) with two flanking terminal adaptors (20 nt, gray) were cloned into the 3′ UTR of a GFP reporter (center), and in vitro-transcribed to generate mRNA reporters (right) with different 3′ UTR sequences (red and orange). Two reporter pools contained either non-adenylated reporters (A−, top) or pre-adenylated reporters (A+, bottom).
(B) mRNA reporters were microinjected into 1-cell staged zebrafish embryos (left), and hourly RNA samples were collected for the first 10 hr of development (center). Stable mRNAs maintain a similar level in all samples (dark orange), whereas levels of unstable mRNAs decrease over time (light orange). Temporal samples were sequenced and normalized to internal spike-ins to generate a decay profile for each reporter (left).
(C) Temporal (columns; hours post fertilization) mRNA abundance (white, X0; orange, 16-fold above X0; purple, 16-fold below X0; log2 scale) of 34,809 reporters (rows, sorted by their predicted onset times and half-life) that were measured with at least a minimal average coverage in both A+ (left) and A− (right) samples.
See also Figures S1–S3 and Tables S1, S2, and S3.