
- Title
-
Transcriptomics reveal an integrative role for maternal thyroid hormones during zebrafish embryogenesis
- Authors
- Silva, N., Louro, B., Trindade, M., Power, D.M., Campinho, M.A.
- Source
- Full text @ Sci. Rep.

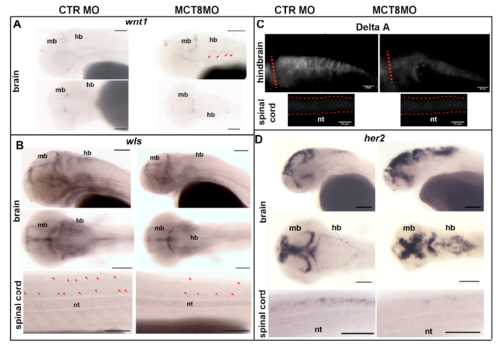
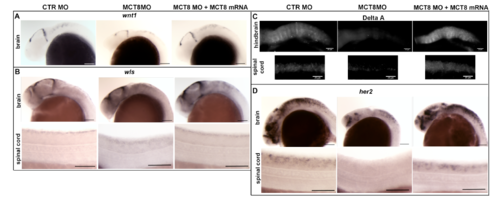
MTHs regulate the WNT and NOTCH pathway genes during zebrafish embryogenesis. (A) WISH expression analysis of wnt1. Lateral (upper panel) and dorsal images of the brain (lower panel) in control and MCT8 morphant zebrafish embryos at 25hpf. (B) WISH expression of the WNT1 protein secretion regulator - wls, lateral and dorsal images of the brain and lateral images of the spinal cord in control and MCT8 morphant zebrafish embryos at 25hpf. The red arrows denote wls - expressing cells in the spinal cord. (C) Fluorescent WIHC expression analysis of the NOTCH ligand DeltaA in the hindbrain and spinal cord of control and MCT8 morphant embryos at 25hpf. (D) WISH expression analysis of the NOTCH pathway target gene her2 in control and MCT8 morphant zebrafish embryos at 25hpf. Lateral and dorsal images of the brain (first and second panels) and lateral images of the spinal cord are shown (lower panel). hb-hindbrain; mb-midbrain; nt-notochord. In (A,B,D) the scale bars represent 100 μm. In (C) the scale bars represents 25 μm. |
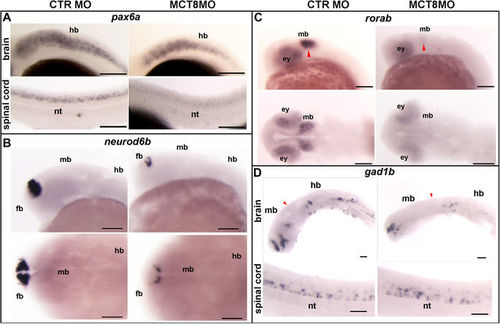
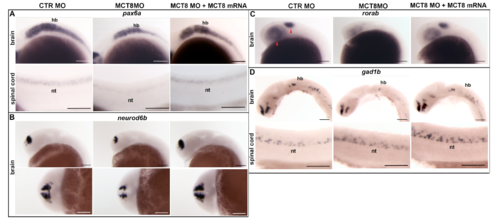
MTHs were involved in zebrafish neural development. The scheme presents a comparison between the control and MCT8 morphant zebrafish embryos at 25hpf. (A) WISH expression analysis of the neural progenitor marker pax6a in control or MCT8 morphant zebrafish embryos at 25hpf; pax6a was regulated in a context dependent manner by MTHs during zebrafish embryogenesis. Lateral images of the hindbrain and spinal cord in embryos are presented. (B) WISH expression analysis of the neural progenitor factor neurod6b. This gene was regulated by MTHs in the mid- and hindbrain. Lateral (upper panel) and dorsal images (lower panel) of the brain in embryos is presented. (C) WISH expression analysis of the retinoic orphan receptor ab (rorab). Regulation by MTHs occurred in the midbrain and eyes. Lateral (first panel) and dorsal images (second panel) of the brain in embryos are presented. Red arrowheads indicate the optic tectum. (D) WISH analysis of the expression of the inhibitory neuron marker, gad1b, showing that the development of inhibitory neurons was dependent on MTHs during zebrafish embryogenesis. Lateral and dorsal images of the brain (first and second panels) and lateral images of the spinal cord (lower panel) in embryos are presented. The red arrowheads indicate the midbrain-hindbrain boundary (MHB). ey – eye, fb – forebrain, hb-hindbrain, md – midbrain, nt-notochord. In all images the scale bars represent 100 μm. |
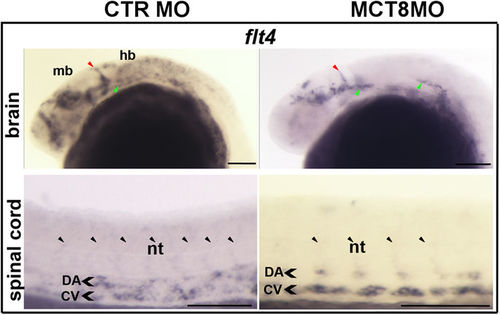
MTHs were important in angiogenesis during zebrafish development. A comparison between control and MCT8 morphant zebrafish embryos at 25hpf is presented. (A). WISH expression analysis of flt4 showed that MTHs regulate flt4 expression in a context dependent manner. Lateral images of the head (first panel) and the trunk (second panel) are shown. The red arrowheads indicate the mid-central vein, the green arrowheads indicate the primordial hindbrain channels and the black arrowheads indicate the intersegmental vessels. CV - Cardinal vein, DA - Dorsal artery, hb – hindbrain, mb – midbrain, nt - notochord. In all the images the scale bar represents 100 μm. |
MTHs regulate WNT and NOTCH pathway genes during zebrafish embryogenesis. WISH expression of differentially expressed genes (p<0.01; FDR 5%) and comparison between control and MCT8 morphant zebrafish embryos at 48hpf. (A)WISH expression analysis of wnt1. Lateral (first panel) and dorsal (second panel) images of brain in control and MCT8 morphant zebrafish embryos at 48hpf. Red arrows denote wnt1 positive cells I the ventral hindbrain. (B) WNT1 protein secretion regulator - wls WISH expression, lateral (first panel) and dorsal (second panel) images of brain and lateral images of spinal cord in control and MCT8 morphant zebrafish embryos at 48hpf. Red arrows denote wls-expressing cells in the spinal cord. (C) Fluorescent WIHC expression analysis of DeltaA NOTCH ligand in hindbrain and spinal cord of control and MCT8 morphant embryos at 48hpf. (D) WISH expression analysis of of NOTCH pathway target gene her2 in control and MCT8 morphant zebrafish embryos at 48hpf. Lateral and dorsal images of brain (first and second panels) of analysed embryos are presented and lateral images of spinal cord are shown (lower panel). hb-hindbrain; mb-midbrain; nt-notochord In A,B,D scale bar represents 100μm. In C scale bar represents 25μm. |
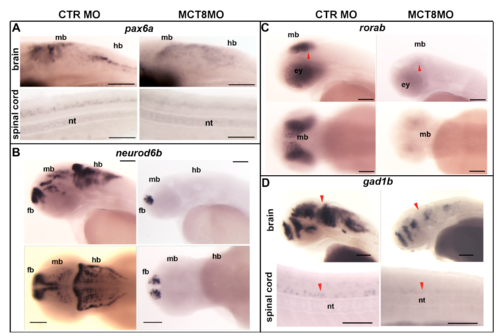
Expression of differentially expressed genes (p<0.01; FDR 5%) involved in zebrafish neural development. Comparison between control and MCT8 morphant zebrafish embryos at 48hpf. (A) WISH expression analysis of neural progenitor marker pax6a, this gene is regulated in a context dependent manner by MTHs during zebrafish embryogenesis. Lateral images of the hindbrain and spinal cord of analysed embryos are presented (B) WISH expression analysis of neural progenitor factor neurod6b. This gene is regulated by MTH in the mid- and hindbrain. Lateral (upper panel) and dorsal images (lower panel) of the brain of analysed embryos is presented. hb-hindbrain, (C) WISH expression analysis of Retinoic orphan receptor ab (rorab). Regulation by MTH occurs in the midbrain and eyes. Lateral (first panel) and dorsal images (second panel) of the brain of analysed embryos are presented. Red arrowheads indicate the optic tectum. (D) WISH analysis of expression of inhibitory neuron marker gad1b, showing that inhibitory neurons development is dependent of MTHs in zebrafish embryogenesis. Lateral and dorsal images of brain (first and second panels) of analysed embryos are presented and lateral images of spinal cord are shown (lower panel). Red arrowhead indicates the midbrain-hindbrain boundary (MHB). nt-notochord, md – midbrain, fb – forebrain, ey – eye. In all images scale bar represents 100μm |
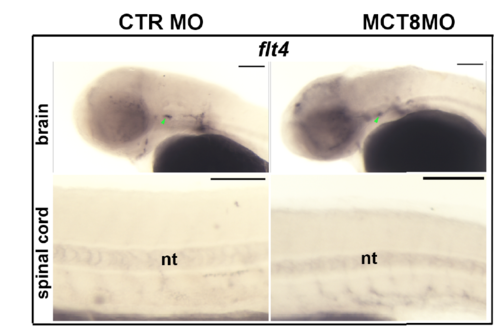
MTHs are important for angiogenesis in zebrafish during development, comparison between control and MCT8 morphant zebrafish embryos at 48hpf (A). WISH expression analysis of flt4 shows that MTHs regulate flt4 expression in a context dependent manner. Lateral images of the head (first panel) and trunk (second panel) are shown. Green arrowhead depicts primordial hindbrain channels. In all images bar represents 100μm. |
Exogenous supply of MCT8 mRNA recovered the expression of genes affected by MCT8 MO to control levels in 25hpf zebrafish. (A) WISH expression analysis of wnt1. Lateral images of brain in control, MCT8 morphant and co-injection of MCT8 mRNA and MCT8 morpholino in zebrafish embryos at 25hpf. (B) WNT1 protein secretion regulator - wls WISH expression, lateral images of brain and lateral images of spinal cord in control, MCT8 morphant and co-injection of MCT8 mRNA and MCT8 morpholino in zebrafish embryos at 25hpf. (C) Fluorescent WIHC expression analysis of DeltaA NOTCH ligand in hindbrain and spinal cord of control, MCT8 morphant and co-injection of MCT8 mRNA and MCT8 morpholino in embryos at 25hpf. (D) WISH expression analysis of of NOTCH pathway target gene her2 in control, MCT8 morphant and co-injection of MCT8 mRNA and MCT8 morpholino in zebrafish embryos at 25hpf. Lateral images of brain and spinal cord of analysed embryos are presented. In A,B,D scale bar represents 100μm. In C scale bar represents 25μm. |
Exogenous supply of MCT8 mRNA recovered the expression of genes affected by MCT8 MO to control levels in 25hpf zebrafish. WISH expression analysis of neural genes in control, MCT8 morphant and coinjection of MCT8 mRNA and MCT8 morpholino. (A) WISH expression analysis of neural progenitor marker pax6a in control. Lateral images of the hindbrain and spinal cord of analysed embryos are presented. (B) WISH expression analysis of neural progenitor factor neurod6b. Lateral (upper panel) and dorsal images (lower panel) of the brain of analysed embryos are presented. (C) WISH expression analysis of retinoic orphan receptor ab (rorab). Lateral images of the brain of analysed embryos are presented. (D) WISH analysis of expression of inhibitory neuron marker gad1b. Lateral images of the brain and spinal cord are presented. In all images scale bars represent 100μm. |
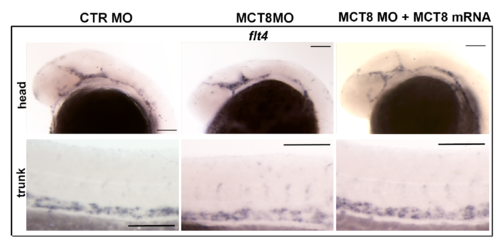
Exogenous supply of MCT8 mRNA recovered the expression of flt4 to control levels in 25hpf zebrafish. WISH expression analysis of flt4 in control, MCT8 morphant and co-injection of MCT8 mRNA and MCT8 morpholino. Lateral images of the head (first panel) and trunk (second panel) are shown. In all images scale bar represent 100μm. |