
- Title
-
Cohesin facilitates zygotic genome activation in zebrafish
- Authors
- Meier, M., Grant, J., Dowdle, A., Thomas, A., Gerton, J., Collas, P., O'Sullivan, J.M., Horsfield, J.A.
- Source
- Full text @ Development
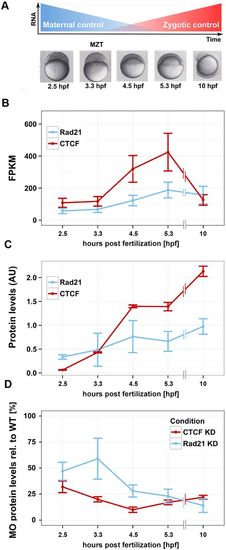
Rad21 and CTCF are present pre-ZGA and can be effectively depleted in early zebrafish development. (A) As embryos reach MZT, maternal transcripts are degraded and zygotic transcripts accumulate. The series of embryos below represents time points that were sampled for RNA-seq. hpf, hours post-fertilization. (B) Transcript numbers expressed as fragments per kilobase mapped (FPKM) of Rad21 and CTCF, measured by RNA-seq across the indicated time points. Error bars represent 95% confidence intervals. (C) Quantitation of immunoblots for Rad21 and CTCF protein levels, normalized against those of γ -tubulin. Data are mean±s.d. n=3. (D) Quantitation of immunoblots for Rad21 and CTCF protein levels, following depletion of these proteins using morpholino oligonucleotides [Rad21 knockdown (KD) and CTCF KD]. Protein levels are expressed as a percentage of wild-type levels and were normalized against those of γ -tubulin. Images of all immunoblots are provided in Fig. S1E. |
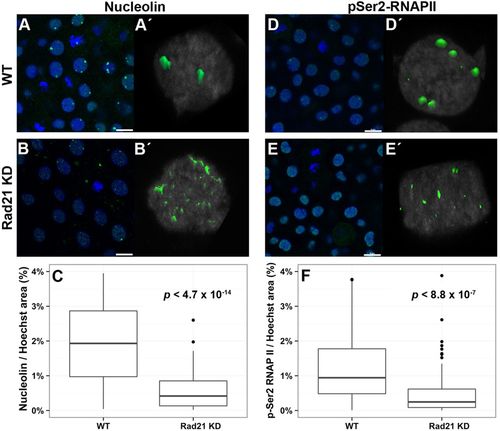
Formation of sub-nuclear structures in post-ZGA embryos is compromised by Rad21 depletion. Rad21-depleted (Rad21 KD) and wild-type stage-matched control embryos at 4.5 hpf were fixed and stained with the indicated antibodies. For all images, nuclei were counterstained with Hoescht. Scale bar: 10 μm. (A,A′) Nucleolin staining (green) in wild type is shown in a field of cells (A) and in a z-stack maximum projection of a single representative nucleus (A′), and indicates the presence of normal nucleoli. (B,B′) Nucleolin staining (green) in Rad21-depleted embryos is shown in a field of cells (B) and in a z-stack maximum projection (B′), and indicates nucleolar dispersion following abrogation of Rad21. (C) Quantification of the area of nucleolin relative to the size of the nucleus in stage-matched wild-type embryos compared with Rad21-depleted embryos at 4.5 hpf (see Materials and methods; n=6 for both conditions) shows that nucleoli fragmentation is significant. Around 200 nuclei for each condition were imaged and analyzed. (D,D′) Staining for the elongating form of RNA polymerase II (p-Ser2-RNAPII) (green) in wild type is shown in a field of cells (D) and in a z-stack maximum projection of a single representative nucleus (D′), and indicates clustering of RNAPII into foci. (E,E′) p-Ser2-RNAPII staining (green) in Rad21-depleted 4.5 hpf embryos is shown in a field of cells (E) and in a z-stack maximum projection (E′), and shows disruption of RNAPII foci upon Rad21 depletion. (F) Quantification of RNAPII foci relative to the size of the nucleus shows statistically significant disruption of RNAPII clustering in Rad21-depleted embryos compared with controls (see Materials and methods; n=6 for both conditions). Around 200 nuclei for each condition were imaged and analyzed. All P values were calculated by applying a t-test with an unpaired fit and assuming a parametric distribution. |
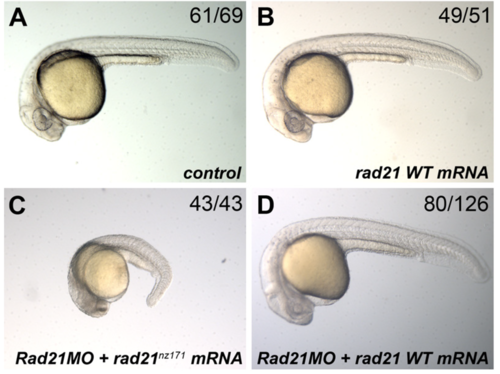
Rescue of Rad21 MO-treated embryos by wild type, but not mutant, rad21 mRNA. Embryos were injected at the 1-cell stage. Images of representative embryos are shown, and the number of embryos exhibiting the displayed phenotype is shown at top left of each panel. (A) control embryo injected with 1 nl Danieau. (B) control embryo injected with 200 pg wild type (WT) rad21 mRNA. (C) non-rescued embryo injected with 0.25 pmol Rad21 MO and 200 pg mutant rad21 mRNA (rad21nz171). (D) rescued embryo injected with 0.25 pmol Rad21 MO and 200 pg WT rad21 mRNA. |
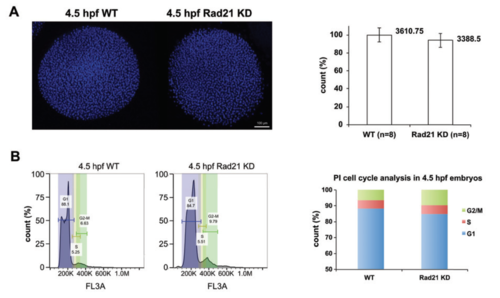
Cell cycle analysis of Rad21-depleted embryos (A) Left, whole mount wild type (WT) and Rad21-depleted (Rad21 KD) embryos at 4.5 hpf. Embryos were fixed in 4% formaldehyde, dechorionated, and dehydrated in methanol. Nuclei were stained with hoechst, and confocal Z-stacks of embryos were obtained (see methods). Right, nuclei were quantified using lmaris software. No significant difference was observed in nuclei numbers between Rad21 KD and WT (n=8, p=0.1138, un-paired t-test). (B) Cell cycle analysis of WT and Rad21 KD embryos. Let, representative propidium iodide staining profiles of 4.5 hpf WT and Rad21 KD embryos, with G1, S, G2/M phases indicated. Right, Rad21 KD embryos had ~50% more cells in G2/M phase compared to WT controls. |