
- Title
-
Proximal Tubular Expression Patterns of Megalin and Cubilin in Proteinuric Nephropathies
- Authors
- Sun, J., Hultenby, K., Axelsson, J., Nordström, J., He, B., Wernerson, A., Lindström, K.
- Source
- Full text @ Kidney Int Rep
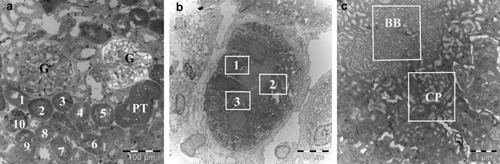
Immunoelectron microscope images show the collection of images for the semiquantification in proximal tubules (PT). (a) Ten proximal tubules (1–10) were randomly selected, and (b) in each tubule, 3 different areas (1–3) were randomly selected. (c) In each area, 1 image (original magnification ×39,000), brush border (BB) and adjacent apical cytoplasm area (CP), was taken separately. G, glomerulus. |
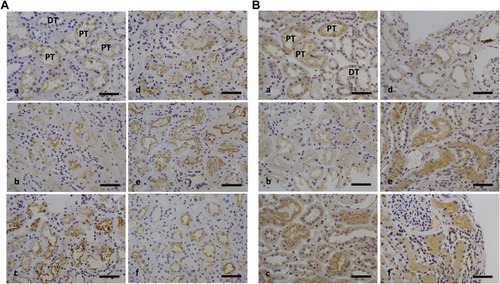
Immunohistochemistry staining using antibodies against (A) megalin and (B) cublin. Biopsies from patients with (a) control, (b) minimal change nephropathy (MCNS), (c) thin membrane disease (TMD), (d) nephrotic-albuminuric IgA nephropathy (IgAN) (>3500 mg/24 hours), (e) macroalbuminuric IgAN (>300 mg/24 hours and <3500 mg/24 hours), and (f) microalbuminuric IgAN (<300 mg/24 hours) show the labeling at different intensities; the most intense staining was observed in the luminal aspect of the proximal tubules (PT), whereas staining of the distal tubules (DT) was at background levels. Bar = 50 μm. |
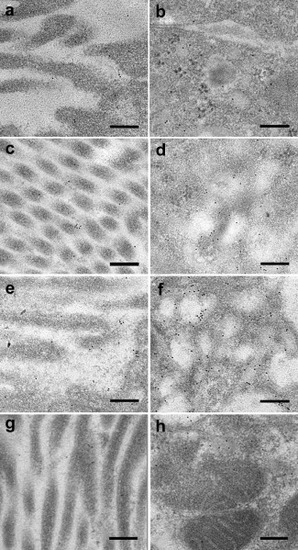
Immunoelectron microscopy images of megalin expression. Images are from IgA nephropathy (IgAN) patients with microalbuminuria (<300 mg/24 hours), macroalbuminuria (>300 mg/24 hours and <3500 mg/24 hours), nephrotic-albuminuria (>3500 mg/24 hours), and controls. The different expression of megalin between the 3 groups is shown in the brush border (left panel) of the proximal tubular cells and in the cytoplasm area (right panel) (original magnification ×39,000). Images (a) and (b) show nephrotic-albuminuric IgAN, (c) and (d) show macroalbuminuric IgAN, (e) and (f) show those with microalbuminuria, and (g) and (h) show controls. Note the increased labeling between the 3 groups. Bar = 200 nm. |
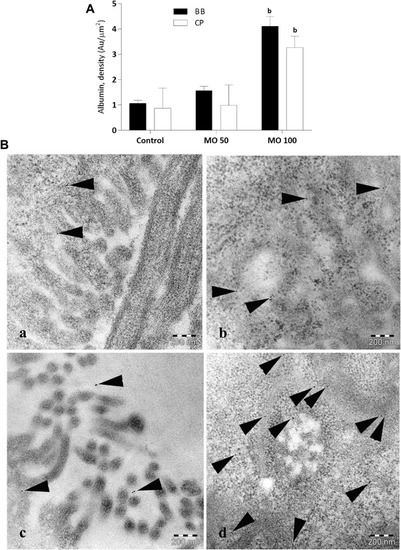
Semiquantification of immunogold-labeled albumin-like protein in proximal tubules of zebrafish. (A) Bar graph illustrates semiquantitative data of protein uptake in proximal tubules. Statistically, (b) denotes results significantly different from controls (P < 0.01). (B) Immunoelectron microscopy images showing gold-labeled albumin-like protein (arrowheads) in controls (a, b) and in nphs2 morphants injected with 100 μM of MO (c, d) in the brush border (left panel) and cytoplasmic vesicles (right panel), respectively (×60,000). Bar = 200 nm. MO, morpholino antisense oligo. |
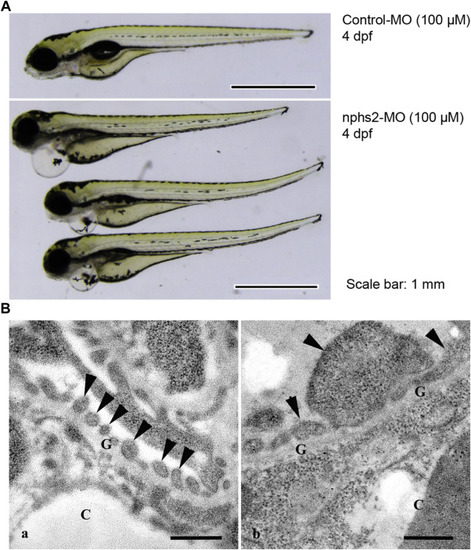
Proteinuric zebrafish model. (A) Phenotype of control (larvae injected with control MO) and nphs2 morphants at 4 days postfertilization (dpf). Nphs2 morphants develop severe late-stage pericardial edema at 4 dpf, often indicating glomerular injury of pronephros. (B) Ultrastructural alteration of 4-dpf zebrafish glomerular podocytes. (a) Controls show fine and regular podocyte foot processes (arrowheads); (b) nphs2 morphants display extensive and irregular podocyte foot processes (arrowheads). Bar (A) = 1 mm, (B) = 500 nm. C, capillary lumen; G, glomerular basement membrane; MO, morpholino antisense oligo. PHENOTYPE:
|

ZFIN is incorporating published figure images and captions as part of an ongoing project. Figures from some publications have not yet been curated, or are not available for display because of copyright restrictions. |