
Image
|
Figure Caption
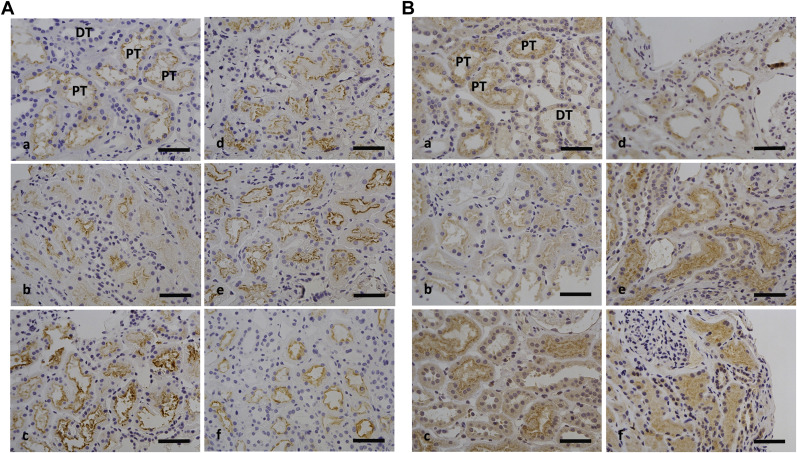
Fig. 2
Immunohistochemistry staining using antibodies against (A) megalin and (B) cublin. Biopsies from patients with (a) control, (b) minimal change nephropathy (MCNS), (c) thin membrane disease (TMD), (d) nephrotic-albuminuric IgA nephropathy (IgAN) (>3500 mg/24 hours), (e) macroalbuminuric IgAN (>300 mg/24 hours and <3500 mg/24 hours), and (f) microalbuminuric IgAN (<300 mg/24 hours) show the labeling at different intensities; the most intense staining was observed in the luminal aspect of the proximal tubules (PT), whereas staining of the distal tubules (DT) was at background levels. Bar = 50 μm.
Acknowledgments
This image is the copyrighted work of the attributed author or publisher, and
ZFIN has permission only to display this image to its users.
Additional permissions should be obtained from the applicable author or publisher of the image.
Full text @ Kidney Int Rep