
- Title
-
Dual modality reflection mode optical coherence and photoacoustic microscopy using an akinetic sensor
- Authors
- Haindl, R., Preisser, S., Andreana, M., Rohringer, W., Sturtzel, C., Distel, M., Chen, Z., Rank, E., Fischer, B., Drexler, W., Liu, M.
- Source
- Full text @ Opt. Lett.
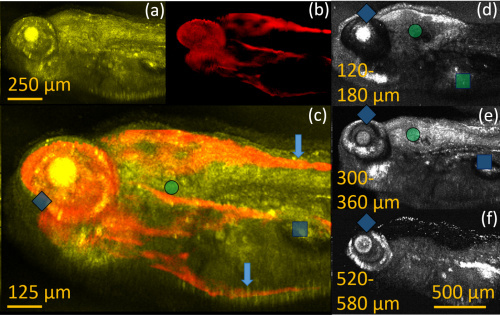
Images of a 120 h post-fertilization (hpf) zebrafish larva. (a) Maximum intensity projection (MIP) image of OCM. (b) MAP image of PAM. (c) Color blended OC-PAM image using (a) and (b). (d)–(f) MIP images of OCM integrating 60 μm depth range. Blue arrow, pigments; blue square, swim bladder; blue diamond, eye; green circle, vesicle with otoliths; green square, yolk sac. |
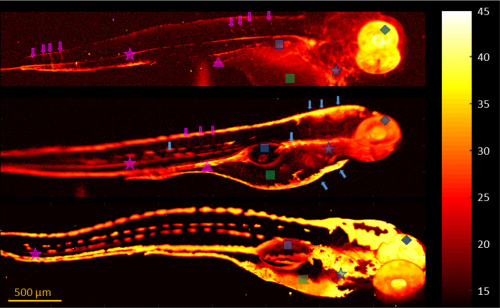
AM comparison between 120 hpf larvae from differently pigmented zebrafish strains using fast scanning PAM. The color bar shows the SNR in decibels. Upper image, mitfa692/692, ednrba140/140 (AB) zebrafish, PTU treated; middle image, wild type AB* zebrafish, PTU treated; lower image, Tg(Fli:GFP) zebrafish. Blue arrows, pigment; blue square, swim bladder; blue diamond, eye; blue star, heart; magenta star, dorsal aorta; tip of magenta triangle, axial vein; magenta arrows, intersegmental vessels; green square, yolk sac. |