
FIGURE
Fig. 3
- ID
- ZDB-FIG-180326-1
- Publication
- Haindl et al., 2017 - Dual modality reflection mode optical coherence and photoacoustic microscopy using an akinetic sensor
- Other Figures
- All Figure Page
- Back to All Figure Page
Fig. 3
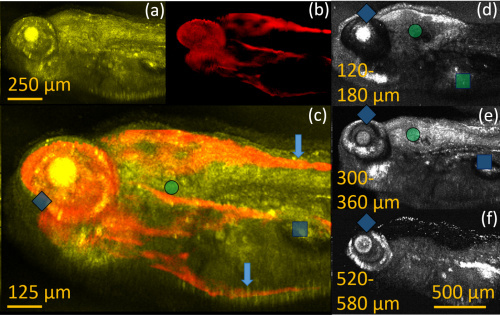
Images of a 120 h post-fertilization (hpf) zebrafish larva. (a) Maximum intensity projection (MIP) image of OCM. (b) MAP image of PAM. (c) Color blended OC-PAM image using (a) and (b). (d)–(f) MIP images of OCM integrating 60 μm depth range. Blue arrow, pigments; blue square, swim bladder; blue diamond, eye; green circle, vesicle with otoliths; green square, yolk sac. |
Expression Data
Expression Detail
Antibody Labeling
Phenotype Data
Phenotype Detail
Acknowledgments
This image is the copyrighted work of the attributed author or publisher, and
ZFIN has permission only to display this image to its users.
Additional permissions should be obtained from the applicable author or publisher of the image.
Full text @ Opt. Lett.