
- Title
-
Zebrafish (Danio rerio) as a Vertebrate Model Host To Study Colonization, Pathogenesis, and Transmission of Foodborne Escherichia coli O157.
- Authors
- Stones, D.H., Fehr, A.G.J., Thompson, L., Rocha, J., Perez-Soto, N., Madhavan, V.T.P., Voelz, K., Krachler, A.M.
- Source
- Full text @ mSphere
Colonization of larval zebrafish by waterborne and foodborne EHEC. (A) Waterborne EHEC infection. Zebrafish larvae were exposed to EHEC for 16 h at the indicated concentrations. Following exposure, fish were washed thoroughly and homogenized and CFU counts were determined by dilution plating on EHEC selective agar. Individual data points (n = 18 for each concentration) and means and SD are shown. (B) Zebrafish larvae were exposed to foodborne (magenta) or waterborne (purple) EHEC for 2 h, at the indicated doses. The bacterial burden was determined by dilution plating on EHEC selective agar. Individual data points (n = 28 for each condition), means, and SD are shown. (C) Zebrafish larvae were exposed to 108 CFU/ml of foodborne (magenta) or waterborne (purple) EHEC for 2 h and transferred to fresh sterile medium, and bacterial burden was determined by dilution plating on EHEC selective agar at the indicated time points. Individual data points, means (n = 10 for each condition), and SD are shown. Statistical significance was calculated using the Mann-Whitney U test (***, P < 0.005; **; P < 0.01; *, P < 0.05). (D and E) Live images of zebrafish larvae exposed to foodborne (D) or waterborne (E) EHEC::mCherry (108 CFU/ml) for 2 h. A whole embryo (i) and a magnified section of a mid-intestinal region are shown at magnifications of ×20 (ii) and ×64 (iii). Scale bars in panels D and E are 100 μm and 20 μm for panels ii and iii, respectively. |
EHEC triggers transient neutrophil recruitment to the intestinal region and surrounding tissue upon colonization. mpo::gfp zebrafish larvae were exposed to 108 CFU/ml foodborne EHEC::mCherry for 2 h, washed, mounted live in low-melting-temperature agarose-containing tricaine, and imaged for 12 h at 32°C. (A) Representative frames showing intestinal tract of infected fish after 0 h (Ai), 4 h (Aii), 8 h (Aiii), and 12 h (Aiv). Accumulation of fecal matter at the anal opening is also visible. (B) Neutrophils in the intestinal region and surrounding tissue (counts from the intestinal region as shown in panel A) were enumerated. Individual data points from infected fish (gray) and uninfected fish (blue), means (n = 5 per condition), and SD are shown. The statistical significance of results of comparisons between infected and uninfected fish for individual time points was determined using Student’s t test (*, P < 0.05; **, P < 0.01). ns, not significant. |
EHEC induced the locus of enterocyte effacement at the site of colonization. (A) Micrograph of Sakai wild-type (wt) EHEC::mCherry cotransformed with LEE1::gfp grown planktonically in E3 medium and zebrafish colonization by EHEC::mCherry/LEE1::gfp. Also see Movie S2 for a time-lapse presentation of the course of the infection shown in panel A. (B) Wild-type EHEC::mCherry cotransformed with promoterless control U9::gfp grown planktonically and zebrafish colonization by EHEC::mCherry cotransformed with U9::gfp. Zebrafish were exposed to 108 CFU/ml of food-borne EHEC for 2 h. (C) EHEC Sakai isogenic ΔtolA mutant transformed with mCherry and LEE1::gfp grown planktonically and during zebrafish colonization. (D) EHEC Sakai isogenic ΔtolA mutant transformed with mCherry and promoterless U9::gfp grown planktonically and during zebrafish colonization. (E) Bacterial burden was determined by dilution plating on EHEC selective agar. Individual data points (n = 15 for each condition), means, and SD are shown. Statistical significance was determined using Student’s t test (***, P < 0.001). (F) Growth curves of the Sakai wild-type strain (blue) and the ΔtolA mutant (red). (G) Degradation profiles for the Sakai wild-type strain (blue) and the ΔtolA mutant (red) in P. caudatum as determined by lysis and dilution plating. Regression analysis showed that there is no difference between the slopes (P = 0.7016). |
LEE expression and colonization of EHEC ΔadhE. (A) EHEC TUV 93-0 wild type transformed with mCherry and LEE1::gfp grown planktonically in E3 medium and in zebrafish. (B) EHEC TUV 93-0 wild type transformed with mCherry and promoterless U9::gfp grown planktonically and in zebrafish. (C) EHEC TUV 93-0 isogenic ΔadhE mutant transformed with mCherry and LEE1::gfp grown planktonically and in zebrafish. (D) EHEC TUV 93-0 isogenic ΔadhE mutant transformed with mCherry and promoterless U9::gfp grown planktonically and in zebrafish. (E) Bacterial burden was determined by dilution plating on EHEC selective agar. Individual data points (n = 15 for each condition), means, and SD are shown. Statistical significance was determined using Student’s t test (**, P < 0.01). (F) Growth curves of TUV 93-0 wild type (pink) and ΔadhE mutant (orange). Means (n = 3) and SD are shown. (G) Degradation profiles for TUV 93-0 wild type (pink) and ΔadhE mutant (orange) in P. caudatum as determined by lysis of P. caudatum and dilution plating. Regression analysis showed there is no difference between the slopes (P = 0.2909). |
EHEC ingestion causes dose-dependent and strain-specific mortality in zebrafish. Zebrafish at 4 dpf were infected with 108 CFU/ml (A and B) or 109 CFU/ml (C and D) of EHEC (Sakai wt, blue full squares; Sakai tolA, empty squares; TUV 93-0 wt, red filled circles; TUV adhE, red empty circles) or left uninfected (black line below tolA data) and incubated at 32°C for up to 6 dpi. Fish were assessed for vital signs (presence of movement or heartbeat or circulation) every 24 h, and percent survival was plotted using Kaplan-Meier analysis (n = 15 fish per condition, over three independent experiments). Statistical significance was assessed using a Mantel-Cox test. Images of fish infected with EHEC wild-type Sakai::mCherry were taken at 21 hpi (as indicated by an arrow in each survival graph). |
Zebrafish as a model to study fecal shedding and transmission. (A) Scheme depicting experimental setup of shedding and transmission experiment. Infected AB embryos were transferred into fresh media housing naive Tg(mpo::egfp) embryos (both 4 dpf). Posttransfer, shedding of EHEC into the media and transfer to recipient animals were monitored over time. (B) EHEC shed into the media were enumerated immediately and at 6, 12, and 24 h posttransfer of infected AB embryos into fresh media. Shown are individual data points, means, and SD (n = 5/time point). (C) The bacterial burden of Tg(mpo:egfp) recipient embryos was quantified immediately and at 6, 12, and 24 h posttransfer of infected AB (donor) embryos. Shown are individual data points, means, and SD (n = 10 embryos/time point). Statistical significance was calculated using the Kruskal-Wallis test with Dunn’s multiple-comparison test (*, P < 0.05). (D) Example of EHEC::mCherry localization in recipient embryos. |
The zebrafish microbiota provides a barrier to E. coli colonization. (A) Following exposure of conventionalized (conv) or gnotobiotic zebrafish larvae to foodborne EHEC (108 CFU/ml) for 2 h, bacterial burden was determined by dilution plating on EHEC selective agar. Individual data points, means (n = 20 for each condition), and SD are shown. Statistical significance was determined using Student’s t test (****, P < 0.0001). (B) Examples of larval homogenates derived from conventionalized fish following EHEC infection, plated on EHEC selective CHROMagar. Mauve, blue, and white colonies correspond to EHEC, other coliforms, and Proteus sp., respectively. (C) Colonization of conventionalized zebrafish with EHEC::mCherry following 2 (Ci), 8 (Cii), 16 (Ciii), and 24 h (Civ) of infection. |
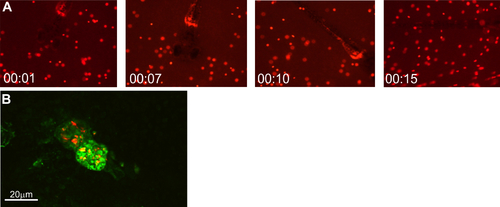
(A) Stills from Movie S1 showing a zebrafish larva at 4 dpf preying on P. caudatum loaded with EHEC Sakai::mCherry. (B) Baclight green-stained paramecia (green) containing EHEC::mCherry (red) inside the foregut of a live zebrafish at 2 h postinfection, following mounting in 1% low-melting-temperature agarose and imaging on an Olympus IX83 microscope with a Fluoview FW3000 confocal system. |