
- Title
-
Optical trapping of otoliths drives vestibular behaviours in larval zebrafish
- Authors
- Favre-Bulle, I.A., Stilgoe, A.B., Rubinsztein-Dunlop, H., Scott, E.K.
- Source
- Full text @ Nat. Commun.
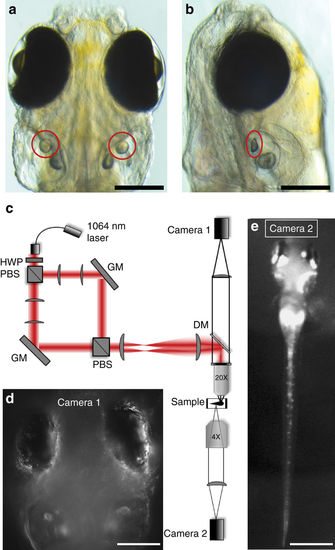
Optical setup for otolith OT and behavioural imaging. Dorsal (a) and lateral (b) views, indicating the location of the utricular otoliths (circles) in a 6dpf zebrafish larva (scale bars, 200 µm). c Experimental set up (see Supplementary Methods for details) for delivering a dual OT to the larva using a 1064 nm fibre laser, a half-wave plate (HWP), polarising beam splitters (PBS), gimbal-mounted mirrors (GM), a dichroic mirror (DM), and lenses to project the two traps into the sample via a 20X 1NA microscope objective. Camera 1 (d) allows targeting of the OTs and imaging of the eyes (scale bar, 200 µm), and camera 2 (e) permits imaging of tail movements (scale bar, 600 µm) |
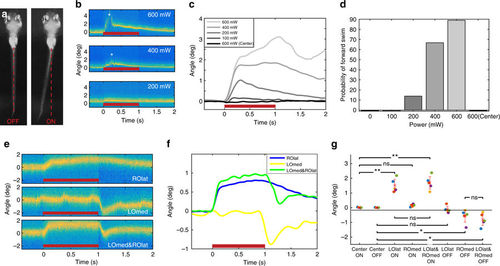
Otolith trapping results in coordinated compensatory movements in the tail. a Tail position of a larva before (left) and during (right) a 600 mW optical trap to the outside of the right otolith. b Tail positions during trap (red bar) with different laser powers. Forward swimming (asterisks) is evident during the 400 and 600 mW trials. c Tail deflection increases with laser power, and a 600 mW trap to the centre of the otolith has no effect (average of trials from one larva). Responses for all larvae are shown in Supplementary Fig. 4. d The probability of forward swimming increases with increased laser power (n = 6 larvae, 3 trials at each power). e Tail positions for a representative trial during a trap (600 mW) to the lateral edge of the right otolith (ROlat), the interior of the left otolith (LOmed), or a double trap of both. f Average of trials from one larva. The combined tail response is roughly a linear sum of the two separate traps’ effects. Responses for all larvae are shown in Supplementary Fig. 5. g Responses to the onsets and offsets of different trap combinations. n = 5 larvae (different colours), and each point represents an average of 2–3 trials (after the application of exclusion criteria, see ‘Methods’ section). Mean + /− SEM is shown, *p < 0.05, **p < 0.01, paired t test). Larvae were tested in both left/right orientations, but for clarity, LOlat/ROmed animals are flipped in this figure |
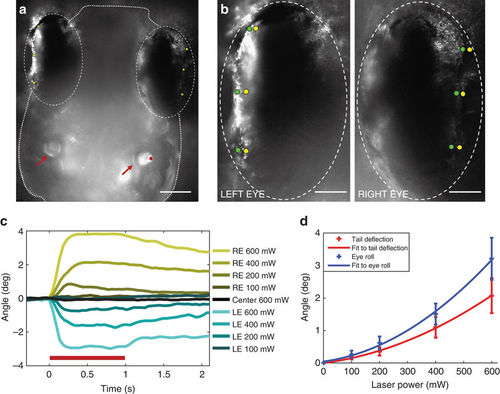
Otolith trapping results in coordinated compensatory movements in eyes. a Dorsal view of a larva. Otoliths (red arrows), the position of the trap on the lateral edge of the right otolith (red dot), and pigment landmarks on the eyes (yellow dots) are indicated. Scale bar, 100 µm. b Positions of pigment landmarks from a before (yellow) and during (green) a 600 mW trap. Scale bar, 50 µm. c Rotation of the left (LE, blue) and right (RE, yellow) eyes vs. the midline at a range of trap powers (average of three trials from one larva). Responses for all larvae are shown in Supplementary Fig. 6. d Average across all fish (n = 5) of the maximum deflection angle for the tail in red, and maximum eye roll in blue. Second order polynomial curves fitting these data are shown, and SEM is indicated for each power |