
|
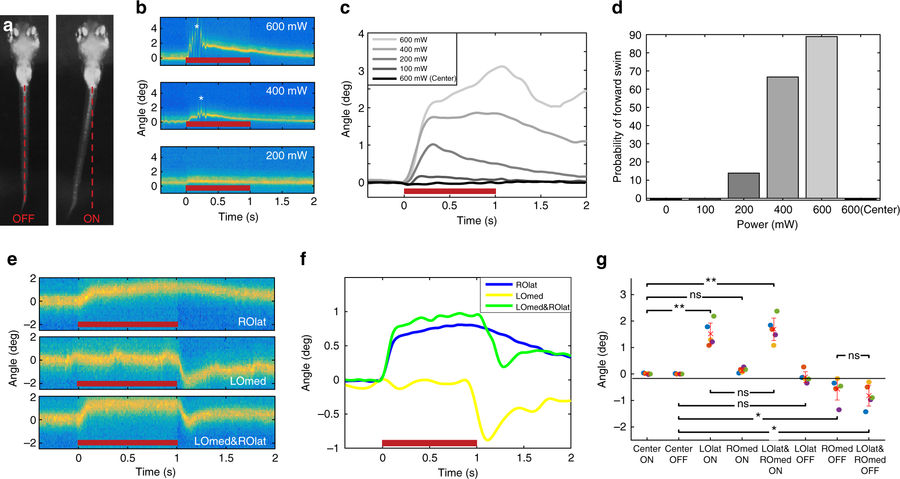
Fig. 3
Otolith trapping results in coordinated compensatory movements in the tail. a Tail position of a larva before (left) and during (right) a 600 mW optical trap to the outside of the right otolith. b Tail positions during trap (red bar) with different laser powers. Forward swimming (asterisks) is evident during the 400 and 600 mW trials. c Tail deflection increases with laser power, and a 600 mW trap to the centre of the otolith has no effect (average of trials from one larva). Responses for all larvae are shown in Supplementary Fig. 4. d The probability of forward swimming increases with increased laser power (n = 6 larvae, 3 trials at each power). e Tail positions for a representative trial during a trap (600 mW) to the lateral edge of the right otolith (ROlat), the interior of the left otolith (LOmed), or a double trap of both. f Average of trials from one larva. The combined tail response is roughly a linear sum of the two separate traps’ effects. Responses for all larvae are shown in Supplementary Fig. 5. g Responses to the onsets and offsets of different trap combinations. n = 5 larvae (different colours), and each point represents an average of 2–3 trials (after the application of exclusion criteria, see ‘Methods’ section). Mean + /− SEM is shown, *p < 0.05, **p < 0.01, paired t test). Larvae were tested in both left/right orientations, but for clarity, LOlat/ROmed animals are flipped in this figure