
- Title
-
Systems biology derived source-sink mechanism of BMP gradient formation
- Authors
- Zinski, J., Bu, Y., Wang, X., Dou, W., Umulis, D., Mullins, M.
- Source
- Full text @ Elife
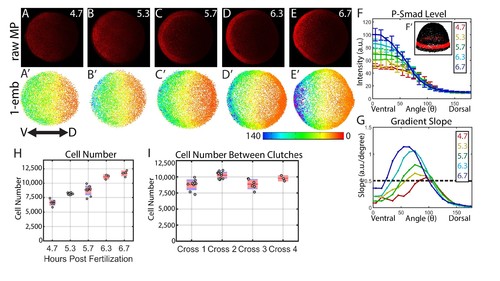
Dynamics of the WT P-Smad5 gradient across head and trunk patterning. (A–E) Animal views of maximum projections (MP) of P-Smad5 stained individual embryos. (A’–E’) Animal views of nuclear intensities of all nuclei from the embryos shown above. (F) Average marginal intensities for 4.7–6.7 hpf (4.7: N = 3, 5.3: N = 4, 5.7: N = 13, 6.3: N = 11, 6.7: N = 4). Error bars indicate standard deviation. (G) Slope of the P-Smad5 gradients shown in panel F. Dotted line separates high slope (>0.5 a.u./deg) regions from low slope regions. (H) Change in cell number versus (vs.) developmental time of embryos fixed from a single cross and nuclei stained with Sytox Orange. (I) Cell number varies between different crosses of WT fish fixed at 5.7 hpf. (H,I) Gray dots are individual embryo cell counts. Red lines show the mean number of cells at a given time point, red boxes show 95% confidence interval, blue boxes show one standard deviation. |
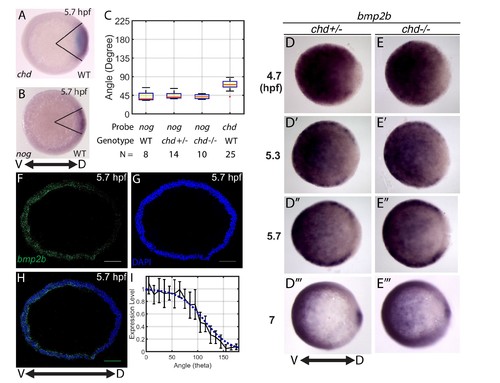
Measuring the bmp2b, chordin, and noggin expression domains. Animal pole views of wholemount in situ hybridizations of the expression of (A) chd (N = 25), and (B) nog (N = 8) in WT embryos. (C) Measured domain size of chd and nog domains via wholemount in situ hybridization in WT and chd mutant embryos. (D–D’’’) bmp2b in chd ± embryos at 4.7 (N = 10), 5.3 (N = 15), 5.7 (N = 20), and 7 hpf (N = 16), and (E–E’’’) bmp2b expression in chd -/- embryos at 4.7 (N = 6), 5.3 (N = 16), 5.7 (N = 13), and 7 hpf (N = 12). (F–H) Fluorescent in situ hybridization (FISH) signal of bmp2b from a marginal slice at 5.7 hpf with a DAPI nuclear stain. Scale bars = 100 μm. (I) Quantification of FISH of bmp2b expression from ventral to dorsal (black line, N = 5) compared to the BMP production gradient used in the mathematical model (blue dotted line). Error bars indicate standard deviation. |
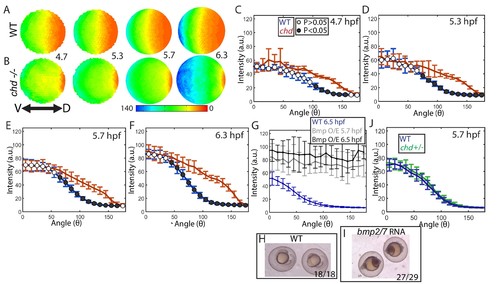
Effect of Chd on gradient shape and ligand shuttling. (A,B) Animal views of average intensities from each time-point in (A) WT (4.7: N = 3, 5.3: N = 4, 5.7: N = 13, 6.3: N = 11) and (B) chd mutant (4.7: N = 3, 5.3: N = 5, 5.7: N = 11, 6.3: N = 9) embryos. (C–F) Average marginal intensities for WT (blue) and chd mutant (red) embryos from 5.7 to 6.3 hpf. (G) Average marginal intensities for WT (blue, N = 4) and bmp2/7 RNA injected embryos at 5.7 (grey, N = 4) and 6.3 hpf (black, N = 5). Error bars indicate standard deviation. (H,I) Fully ventralized (V5) embryos injected with 6 pg of bmp7a RNA and 12 pg of bmp2b RNA vs uninjected WT siblings. (J) WT (N = 9) vs chd+/- (N = 10) at 5.7 hpf. |
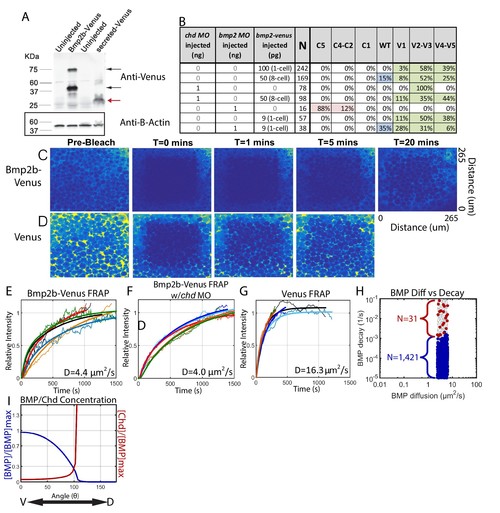
Measuring Bmp2b-Venus diffusivity via FRAP. (A) Detection of Bmp2b-Venus and secreted Venus proteins by western blot. Embryos were injected with bmp2b-venus mRNA (250 pg) or secreted-Venus mRNA (200 pg) at the one-cell stage. Protein lysates were prepared at late blastula stage. In the Bmp2b-Venus overexpression sample, two major protein bands were detected by Venus antibody (black arrows). The larger molecular weight protein is the pro- and mature domains of Bmp2b with Venus protein (669 amino acids (AA),~74 KDa). The smaller protein is the mature domain of Bmp2b with Venus protein (376 AA,~41 KDa). The secreted Venus protein (248 AA,~27 KDa) is also detected in the secreted-Venus overexpression sample (red arrow). β-actin was used as a loading control. (B) 24 hpf phenotypes of embryos injected with the bmp2b-venus construct used for FRAP experiments, controls, and rescue. Dorsalization was classified as C5: Loss of all ventral structures; C4-C3: Loss of, or truncated tail; C2-C1: Loss of ventral tail fin. Ventralization is classified as V1: reduction is eye size; V2-V3: the eyes, notochord, and anterior brain are partially or completely absent; or V4-V5: complete loss of all dorsal structures. Fluorescent BMP-Venus (C) or Venus (D) recovery after photobleaching for 20 min. (E–G) Plots of fluorescent intensity recovery in the extracellular region. Bold lines are mean curves, thin lines are raw intensity data. (H) BMP diffusivity vs. BMP decay rate for simulations that fit WT, chd +/-, and chd -/- P-Smad5 profiles and were within 2 µm2/s of 4.4 µm2/s. Large blue circles are simulations classified as source-sink, red are counter-gradient, and small grey dots failed to fit the measured P-Smad5 profiles. (I) The mean BMP and Chd concentrations in all solutions that fit the WT, chd-/-, and chd +/- P-Smad5 data and within a diffusivity of 2.4 and 6.4 µm2/s that are also robust to uniform Chd production. |
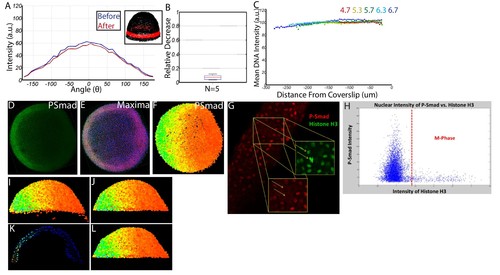
Quantifying nuclear P-Smad5 intensities embryo-wide. (A) Marginal P-Smad5 intensity from a chd LOF embryo imaged twice. (B) Average P-Smad5 intensity drop-off from photo-bleaching of all nuclei in embryos imaged twice (N = 5). (C) There is minimal intensity drop-off due to spherical aberration, as shown by the average intensity of the nuclear DNA stain (Sytox Orange) versus distance from the coverslip (4.7: N = 3, 5.3: N = 4, 5.7: N = 13, 6.3: N = 11, 6.7: N = 4). (D) Maximum projection of an animal view of a single embryo. (E) Nuclei centerpoints (red dots) identified from the sytox nuclear stain (blue). (F) Measured centerpoint nuclear intensities displayed as a heatmap. (G) P-Smad5 is absent in dividing cells (red stain, yellow arrows). Dividing cells have bright condensed chromatin (green stain, yellow arrows). (H) Bright condensed chromatin was used to identify dividing cells. Cells with a 40% elevated DNA stain over the mean (red line) were eliminated from the analysis. (I) Lateral view of a single embryo. (J) Sparse Yolk Syncytial Layer nuclei below the margin are eliminated. (K) Single lateral slice depicting the elimination of remaining yolk syncytial layer nuclei and enveloping layer nuclei by subtracting the outer 15% of all nuclei (filled in circles) to leave only deep cell nuclei (open circles). (L) Lateral view of embryo after outer 15% has been eliminated. |