
|
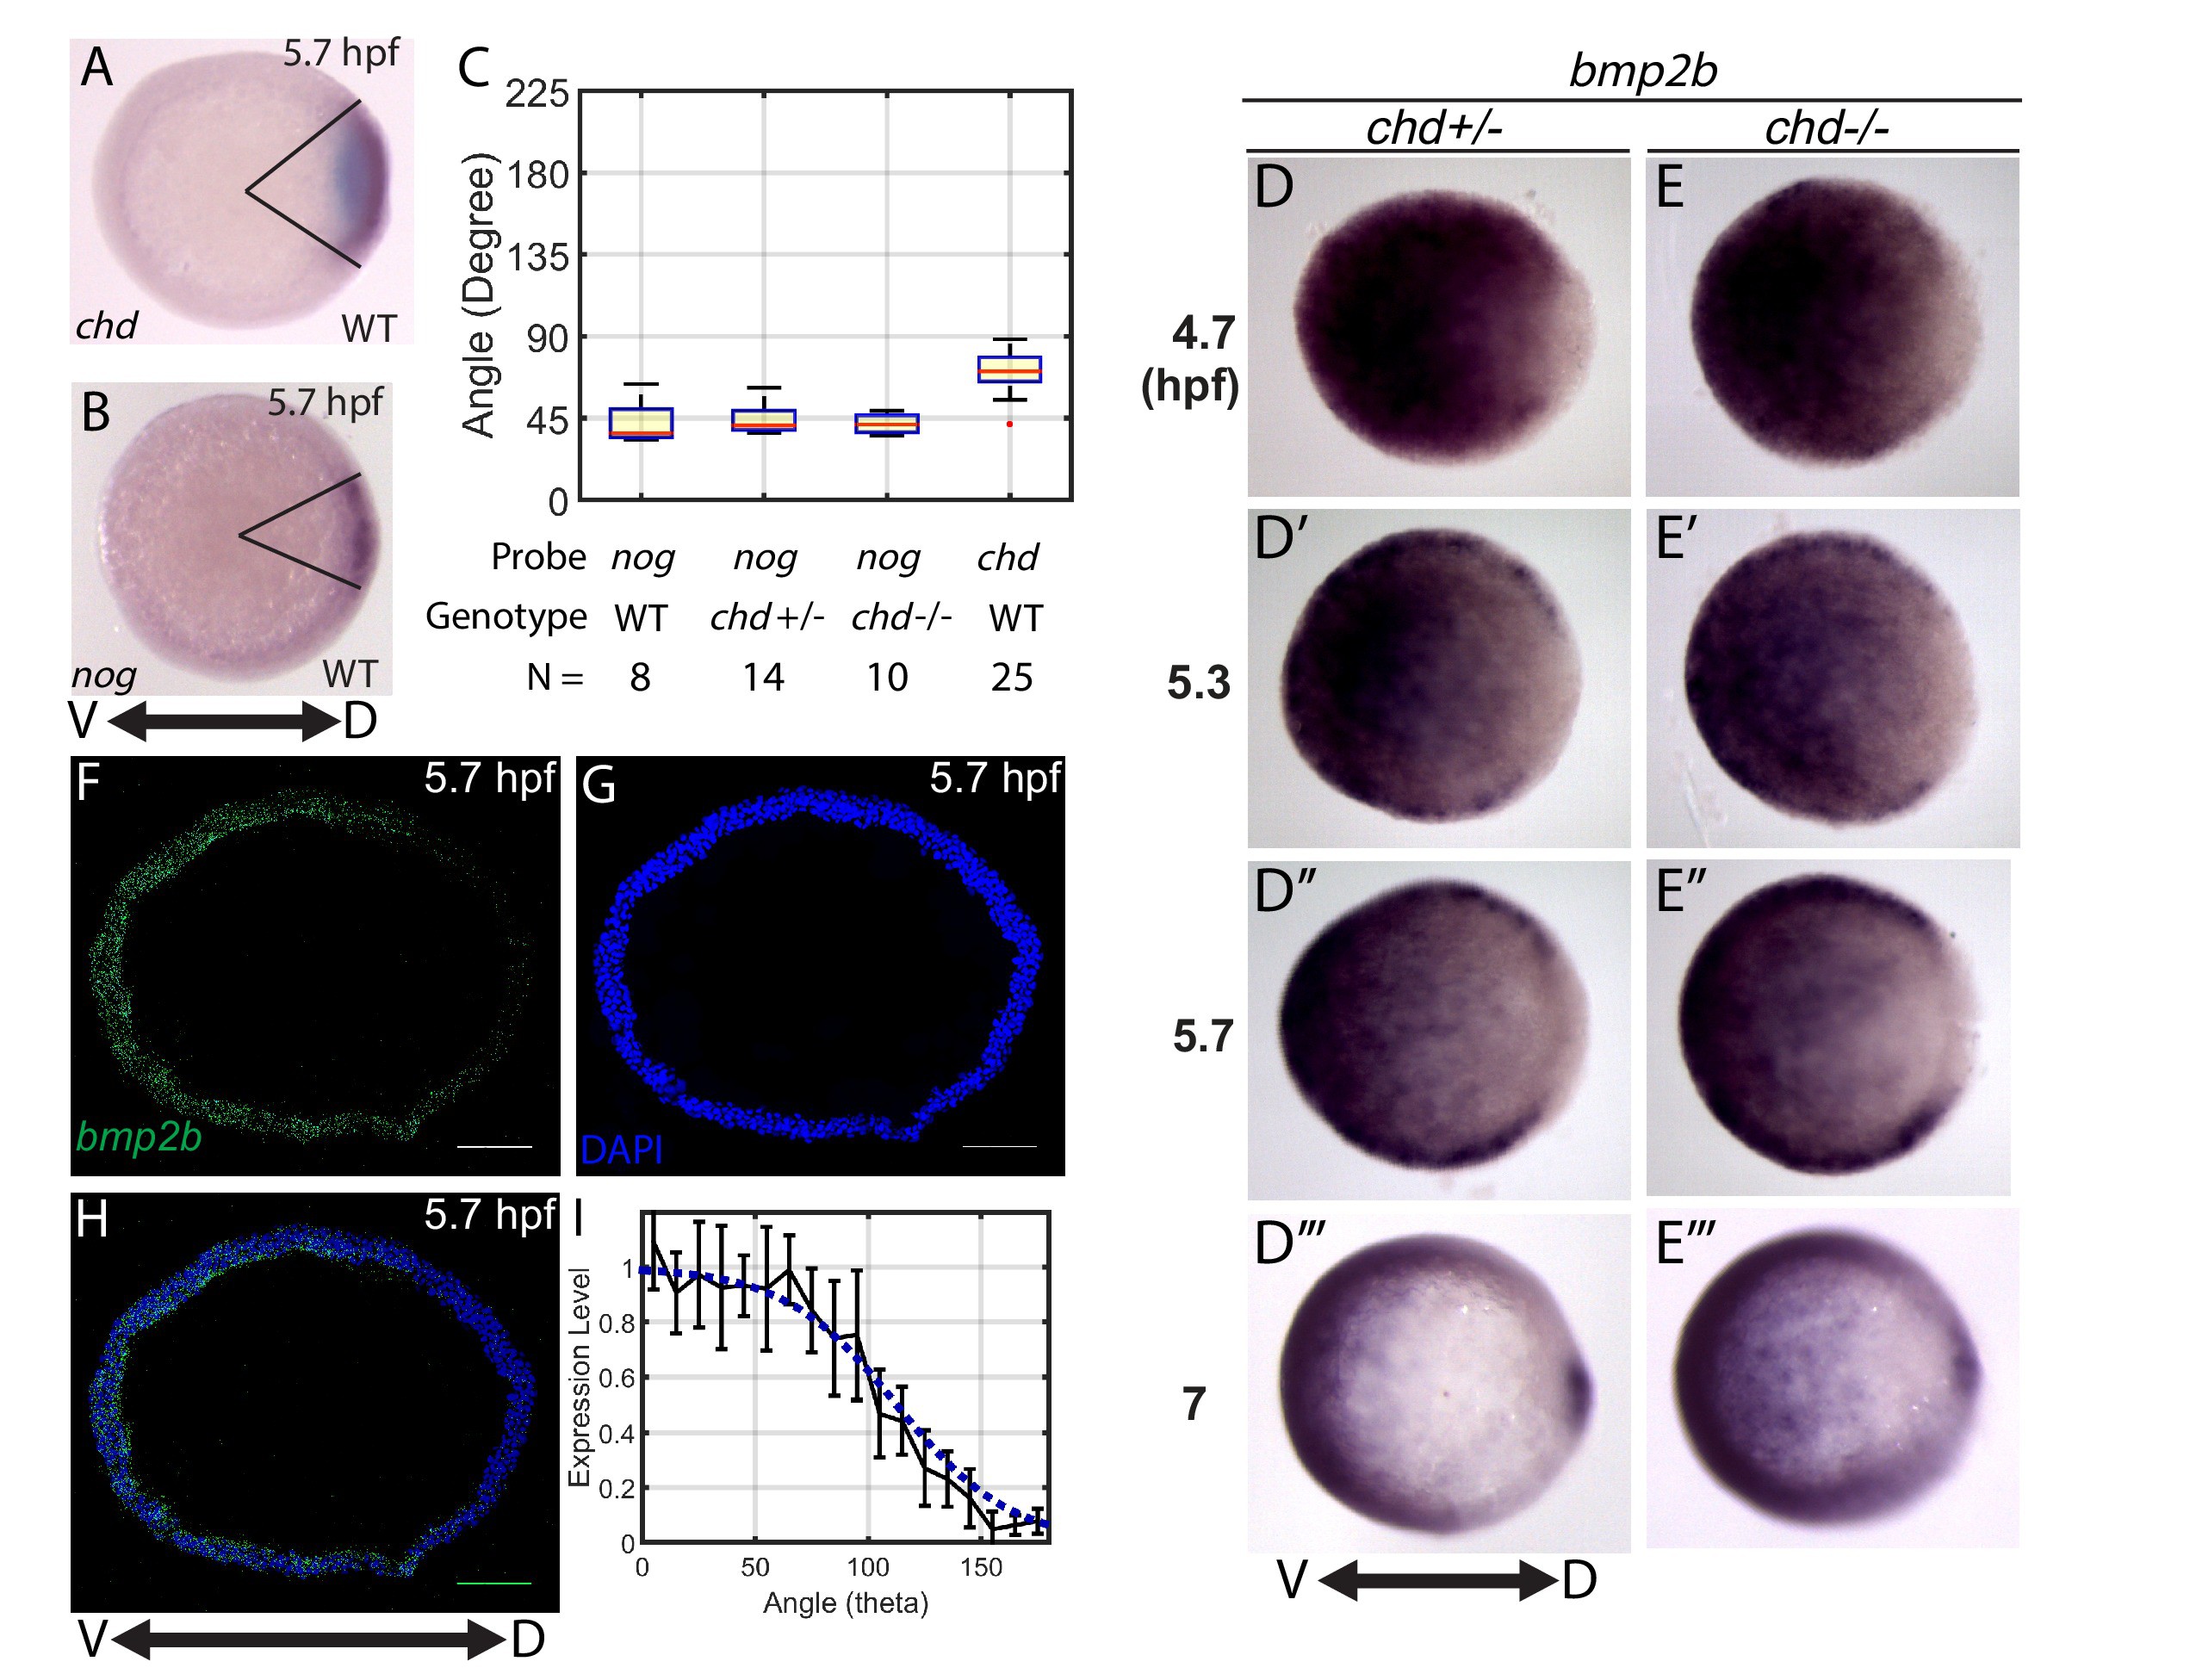
Fig. 3
Measuring the bmp2b, chordin, and noggin expression domains.
Animal pole views of wholemount in situ hybridizations of the expression of (A) chd (N = 25), and (B) nog (N = 8) in WT embryos. (C) Measured domain size of chd and nog domains via wholemount in situ hybridization in WT and chd mutant embryos. (D–D’’’) bmp2b in chd ± embryos at 4.7 (N = 10), 5.3 (N = 15), 5.7 (N = 20), and 7 hpf (N = 16), and (E–E’’’) bmp2b expression in chd -/- embryos at 4.7 (N = 6), 5.3 (N = 16), 5.7 (N = 13), and 7 hpf (N = 12). (F–H) Fluorescent in situ hybridization (FISH) signal of bmp2b from a marginal slice at 5.7 hpf with a DAPI nuclear stain. Scale bars = 100 μm. (I) Quantification of FISH of bmp2b expression from ventral to dorsal (black line, N = 5) compared to the BMP production gradient used in the mathematical model (blue dotted line). Error bars indicate standard deviation.