
Fig. 11
- ID
- ZDB-FIG-171004-31
- Publication
- Zinski et al., 2017 - Systems biology derived source-sink mechanism of BMP gradient formation
- Other Figures
- All Figure Page
- Back to All Figure Page
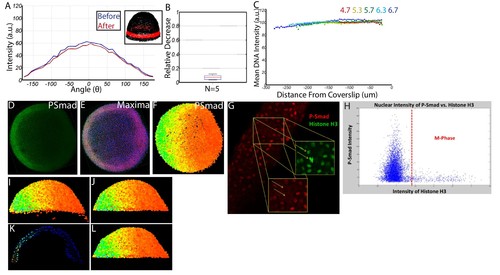
Quantifying nuclear P-Smad5 intensities embryo-wide. (A) Marginal P-Smad5 intensity from a chd LOF embryo imaged twice. (B) Average P-Smad5 intensity drop-off from photo-bleaching of all nuclei in embryos imaged twice (N = 5). (C) There is minimal intensity drop-off due to spherical aberration, as shown by the average intensity of the nuclear DNA stain (Sytox Orange) versus distance from the coverslip (4.7: N = 3, 5.3: N = 4, 5.7: N = 13, 6.3: N = 11, 6.7: N = 4). (D) Maximum projection of an animal view of a single embryo. (E) Nuclei centerpoints (red dots) identified from the sytox nuclear stain (blue). (F) Measured centerpoint nuclear intensities displayed as a heatmap. (G) P-Smad5 is absent in dividing cells (red stain, yellow arrows). Dividing cells have bright condensed chromatin (green stain, yellow arrows). (H) Bright condensed chromatin was used to identify dividing cells. Cells with a 40% elevated DNA stain over the mean (red line) were eliminated from the analysis. (I) Lateral view of a single embryo. (J) Sparse Yolk Syncytial Layer nuclei below the margin are eliminated. (K) Single lateral slice depicting the elimination of remaining yolk syncytial layer nuclei and enveloping layer nuclei by subtracting the outer 15% of all nuclei (filled in circles) to leave only deep cell nuclei (open circles). (L) Lateral view of embryo after outer 15% has been eliminated. |