
- Title
-
The Golgi matrix protein giantin is required for normal cilia function in zebrafish
- Authors
- Bergen, D.J.M., Stevenson, N.L., Skinner, R.E.H., Stephens, D.J., Hammond, C.L.
- Source
- Full text @ Biol. Open
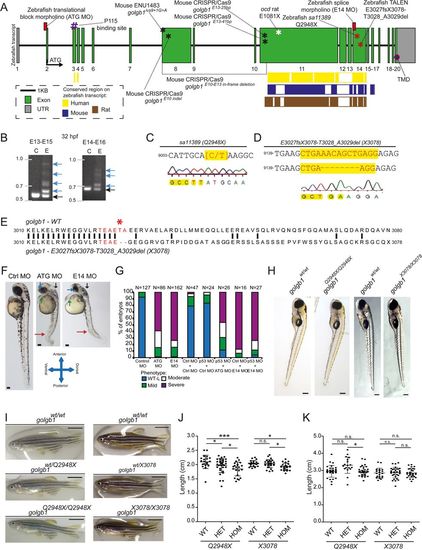
Experimental knockdown and knockout of giantin in vivo. (A) Schematic representation of the zebrafish golgb1 transcript (ENSDART00000131402.2) showing the binding sites of the designed morpholinos (ATG and E14), the relative exonic location of the human annotated p115 binding site, transmembrane domain (TMD), the various mouse mutants (black asterisks) and the ocd rat allele (white asterisk) as described in Lan et al. (2016), and Katayama et al. (2011), respectively. Coloured bars show the interspecies conserved sequence regions as assigned in Ensembl (release 87). Red asterisks indicate the location of zebrafish giantin mutant alleles. (B) Alternative spliced PCR products (blue arrows) from 32 hpf RT-PCR cDNA of two amplicons in E14 MO binding region. Black arrows indicate the expected size of PCR product. (C) Sa11389 line carrying a point mutation from C to T (yellow highlight, red letters) resulting in a premature stop codon at Q2948 (golgb1Q2948X) from the EZRC. (D) TALEN site directed mutagenesis resulted in an 8 bp deletion (spacer sequence in yellow, red letters), resulting in golgb1X3078 mutant line. (E) Alignment of Golgb1 WT protein sequence (Ensembl release 87) with predicted Golgb1 X3078 protein sequence showing translated spacer sequence (red) and site of deletion T3028 and A3029 with a subsequent frameshift from E3027 (red asterisk) changing 51 amino acids to a predicted stop codon at position 3078. Part of cDNA exon 14 sequence. (F) Stereomicroscope images of 48 hpf control, ATG, and E14 morphants exhibiting defects in the eye, heart, cranium, and various axis orientations (blue, green, black, red arrow, respectively). (G) Percentile quantification of scored phenotypes. (H) Stereomicroscope images of heterozygote in-cross 5 dpf larvae from both mutant lines and (I) 7 wpf female adults. (J) Dot plot for body length at 7 wpf, and (K) 44-46 wpf for golgb1Q2948X and 41-43 wpf for golgb1X3078 alleles. Scale bars: (F) 100 µm, (H) 200 µm, (I) 500 µm. (J, K) One-way ANOVA with Tukey's multiple comparison test. All experiments of three replicates. Bars show means with standard deviation. *P<0.05, and *** P<0.005. |
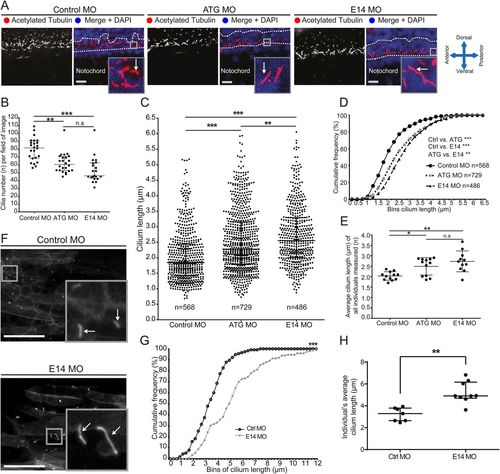
Giantin knockdown leads to changed cilia length and morphology with a ciliopathy-like phenotype in morphant zebrafish. (A) Lateral view confocal images of 24 hpf neural tube ependymal cilia (red in merge, white arrow) were quantified in a two nuclei wide area (dotted line). Nuclei (DAPI-labelled) are shown in blue. Scale bar: 10 μm. (B) Quantification of cilia number per field of image within the two nuclei window (panel A, two images per individual). Scale bar: 50 μm. (C) Scatter dot plot and (D) cumulative frequency plot (0.25 µm bins) of all cilia measured. (E) Average cilium length per individual measured. (F) Representative confocal images of in vivo imaging control and E14 morphants showing Arl13b-GFP-positive cilia (white arrow) in the myotome (lateral view). Scale bars: 10 µm. (G) Arl13b-GFP ciliary membrane length displayed in a cumulative frequency plot of all measured cilia (Ctrl MO: n=115, E14 MO n=152). (H) Average cilium length per individual imaged. On scatter plots (B, C, E, H), bars represent mean with standard deviation and statistical testing was done by one-way ANOVA with a Dunn's multiple comparison test. Data from three independent experiments. *P<0.05, ** P<0.01, and ***P<0.001. EXPRESSION / LABELING:
PHENOTYPE:
|
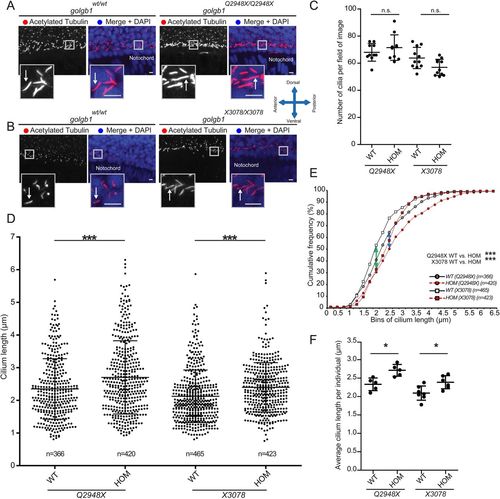
Knockout of giantin results in defects in cilia length. (A,B) Lateral view confocal images of 24 hpf cilia in ventral neural tube of Q2948X mutant line (A) and X3078 mutant line (B). Scale bars: 10 μm. White arrows indicate ciliary axonemes. (C) Cilia number per field of image (two per individual) in a two nuclei wide area adjacent to the notochord. (D,E) Ciliary length of all cilia measured depicted in a scatter dot plot (D) and a cumulative frequency plot (E) showing shift (blue arrow Q2948X and green arrow X3078) in percentile abundance of binned (0.25 µm bins) ciliary length between WT and homozygous 24 hpf embryos. (F) Average ciliary length per individual imaged. Data shown from at least three independent in-crosses. Bars show mean with standard deviation. Data was normally distributed and a subsequent unpaired t-test was performed between wild-type and homozygous groups. *P<0.05, **P<0.01, and ***P<0.001. |
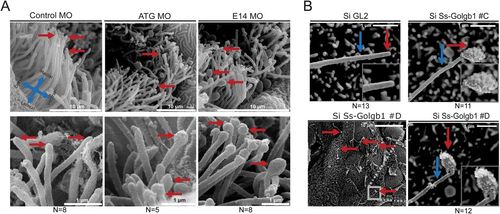
Scanning electron microscopy reveals structural defects in cilia following knockdown of giantin. (A) SEM images olfactory pit (3 dpf) indicating ciliary tips (red arrows). (B) SEM images of LLC-PK1 cells exhibit bulbous ciliary tips (red arrow) with visible ciliary extension (blue arrow) after Ss-Golgb1 knockdown. PHENOTYPE:
|
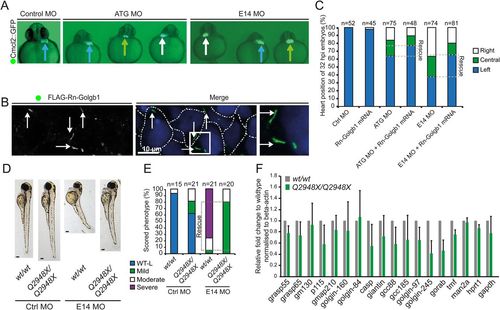
Left-right asymmetry and phenotypic rescue of giantin MO. (A) Cardiomyocyte Cmcl2::GFP transgenic reporter line outlining the heart position (arrows, blue: left; green: midline; white: right) at 32 hpf. (B) Representative confocal image of 48 hpf with ATG morpholino and Rn-Golgb1 mRNA showing Golgi localisation of Rn-Golgb1 in dermal cells stained for anti-flag (white arrows). White dotted line indicates cell boundaries. N=3 individuals. (C) Quantification of heart position (32 hpf), additionally showing Rn-Golgb1 mRNA co-injection rescue. (D) Stereomicroscope images of 3 dpf control and E14 morpholinos injected with same dose in WT and golgb1Q2948X/Q2948X individuals derived from same day WTxWT and golgb1Q2948X/Q2948X x golgb1Q2948X/Q2948X in-crosses with (E) quantification of phenotypes scored. (F) Quantitative RT-PCR of golgins showing relative mRNA expression levels on 5 dpf larvae. Normalised to beta-actin, mean and standard deviation. All data from three independent experiments. EXPRESSION / LABELING:
PHENOTYPE:
|
Protein alignment showing conserved regions of zebrafish Golgb1 with human, mouse, and rat Golgb1. (A) Relatively conserved region corresponding to zebrafish exon-11 covering coiled-coiled domains number 23 and 24 counted from the N-terminus. (B) Evolutionarily conserved regions mapped to zebrafish exon-14 protein sequence, coding for coiled-coiled domains number 32 until 36 included, from a total of 40 annotated coiled-coiled domains in the zebrafish. Clustal OMEGA protein alignment tool (EMBL-EBI (Sievers et al., 2011)) was used to align Golgb1 protein sequences obtained from Ensembl (release #87). |
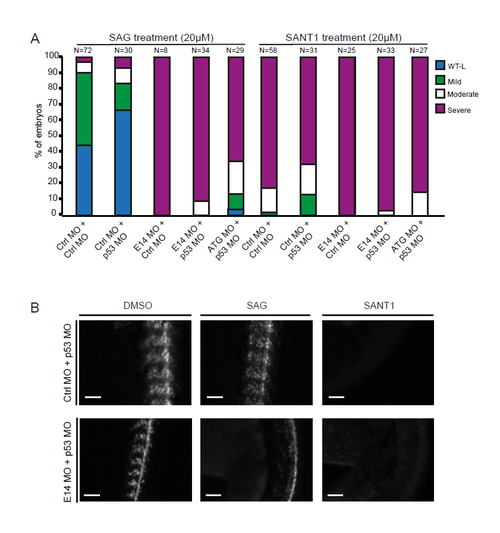
Smoothened agonist treatment does not alter the ciliopathy-like phenotypes in giantin morphants. (A) Quantification of phenotypes observed (48 hpf). Note, no difference is seen with 1 ng p53 morpholino co-injection in all conditions. (B) Gli::mCherry expression was reduced in somites after SANT1 treatment, but not in SAG-treated individuals (48 hpf). SAG: smoothened agonist, SANT1: smoothened antagonist 1. |