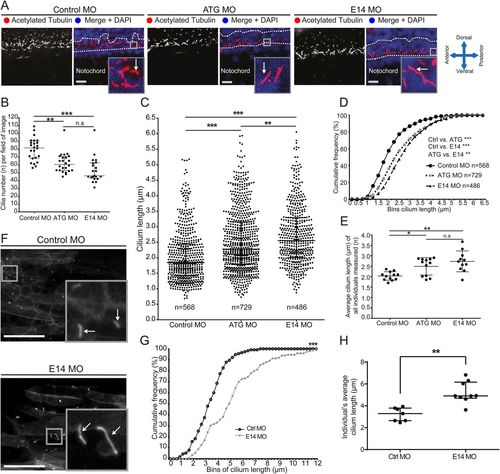
Giantin knockdown leads to changed cilia length and morphology with a ciliopathy-like phenotype in morphant zebrafish. (A) Lateral view confocal images of 24 hpf neural tube ependymal cilia (red in merge, white arrow) were quantified in a two nuclei wide area (dotted line). Nuclei (DAPI-labelled) are shown in blue. Scale bar: 10 μm. (B) Quantification of cilia number per field of image within the two nuclei window (panel A, two images per individual). Scale bar: 50 μm. (C) Scatter dot plot and (D) cumulative frequency plot (0.25 µm bins) of all cilia measured. (E) Average cilium length per individual measured. (F) Representative confocal images of in vivo imaging control and E14 morphants showing Arl13b-GFP-positive cilia (white arrow) in the myotome (lateral view). Scale bars: 10 µm. (G) Arl13b-GFP ciliary membrane length displayed in a cumulative frequency plot of all measured cilia (Ctrl MO: n=115, E14 MO n=152). (H) Average cilium length per individual imaged. On scatter plots (B, C, E, H), bars represent mean with standard deviation and statistical testing was done by one-way ANOVA with a Dunn's multiple comparison test. Data from three independent experiments. *P<0.05, ** P<0.01, and ***P<0.001.
|
