
- Title
-
Development of a Novel Zebrafish Model for Type 2 Diabetes Mellitus
- Authors
- Zang, L., Shimada, Y., Nishimura, N.
- Source
- Full text @ Sci. Rep.

ZFIN is incorporating published figure images and captions as part of an ongoing project. Figures from some publications have not yet been curated, or are not available for display because of copyright restrictions. PHENOTYPE:
|
|
ZFIN is incorporating published figure images and captions as part of an ongoing project. Figures from some publications have not yet been curated, or are not available for display because of copyright restrictions. PHENOTYPE:
|
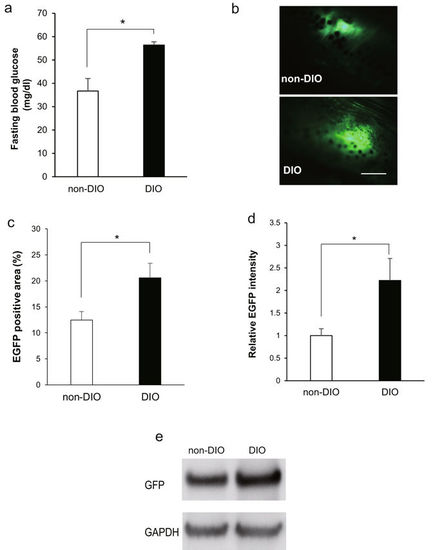
Increased insulin production in DIO zebrafish. (a) Fasting blood glucose concentrations of ins-EGFP zebrafish after 3 months of normal feeding or overfeeding. n = 10. (b) Insulin-EGFP signals in exocrine pancreas were monitored in non-DIO and DIO ins-EGFP zebrafish by fluorescence stereoscopic microscopy. Scale bar = 0.5 mm. (c) Graph of the percentage of EGFP positive signal area in entire image. n = 3. (d) Graph of relative EGFP intensities from panel b. n = 3. (e) Western blot analysis for GFP signals in liver-pancreas tissue of non-DIO and DIO ins-EGFP. Full-length blots are presented in Supplementary Fig. S3. Values are means ± SE. *P < 0.05, **P < 0.01 vs. the non-DIO group. |
|
ZFIN is incorporating published figure images and captions as part of an ongoing project. Figures from some publications have not yet been curated, or are not available for display because of copyright restrictions. PHENOTYPE:
|
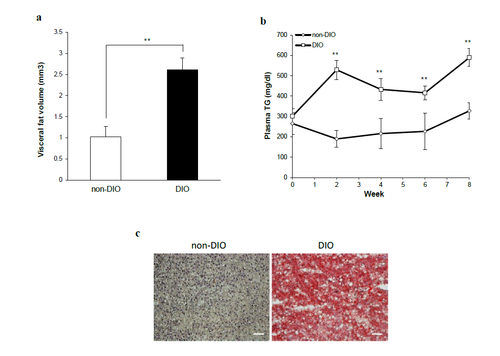
Assessment of visceral adipose tissue volume, plasma TG and hepatic steatosis in overfed zebrafish. (a) Changes in visceral adipose tissue volume in non-DIO and DIO zebrafish. Non-DIO group: n = 14; DIO group: n = 29. (b) Changes in plasma triglyceride (TG) levels in non-DIO and DIO zebrafish. Non-DIO group: n = 14; DIO group: n = 29. (c) Oil red O staining of liver sections. Red droplets indicate neutral lipid staining. Original magnification: × 400. Scale bar = 50 μm. Values are means ± SE. Statistical analyses were performed using Student’s t-test to compare the non-DIO and DIO groups at each time-point. *P < 0.05, **P < 0.01. PHENOTYPE:
|