|
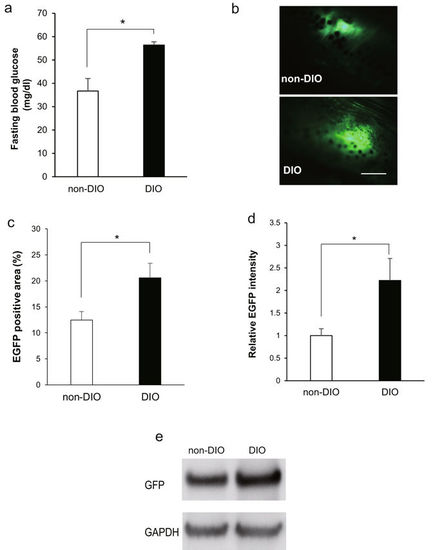
Increased insulin production in DIO zebrafish. (a) Fasting blood glucose concentrations of ins-EGFP zebrafish after 3 months of normal feeding or overfeeding. n = 10. (b) Insulin-EGFP signals in exocrine pancreas were monitored in non-DIO and DIO ins-EGFP zebrafish by fluorescence stereoscopic microscopy. Scale bar = 0.5 mm. (c) Graph of the percentage of EGFP positive signal area in entire image. n = 3. (d) Graph of relative EGFP intensities from panel b. n = 3. (e) Western blot analysis for GFP signals in liver-pancreas tissue of non-DIO and DIO ins-EGFP. Full-length blots are presented in Supplementary Fig. S3. Values are means ± SE. *P < 0.05, **P < 0.01 vs. the non-DIO group.
|