
- Title
-
Altered Adipogenesis in Zebrafish Larvae Following High Fat Diet and Chemical Exposure Is Visualised by Stimulated Raman Scattering Microscopy
- Authors
- den Broeder, M.J., Moester, M.J.B., Kamstra, J.H., Cenijn, P.H., Davidoiu, V., Kamminga, L.M., Ariese, F., de Boer, J.F., Legler, J.
- Source
- Full text @ Int. J. Mol. Sci.
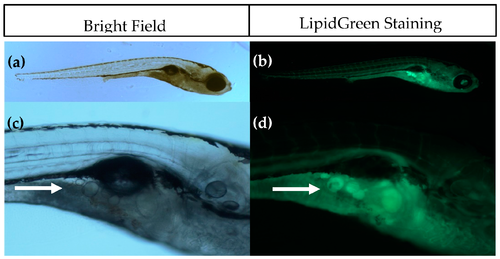
Imaging of adipocytes using Bright Field (left) and fluorescence microscopy after LipidGreen staining (right). (a,b) Representative images of a 15 days post fertilisation (dpf) larvae (5× magnification); (c,d) Close-up of the pancreatic area where the first adipocytes develop. Adipocytes are indicated with a white arrow (16× magnification). |
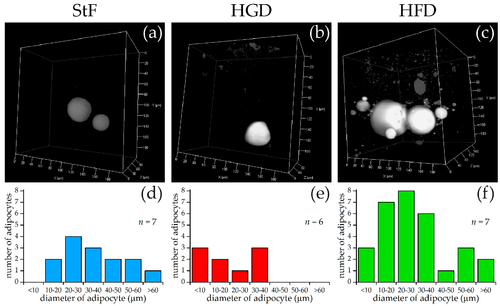
SRS imaging of adipocytes in zebrafish larvae exposed to different diets. (a–c) Representative images of volumes of SRS lipid measurements for standard diet (StF), high glucose diet (HGD) or high fat diet (HFD), respectively; (d–f) Frequency of adipocytes in different size classes following StF (n = 7), HGD (n = 6) and HFD (n = 7) respectively, determined by an automated image processing algorithm in MATLAB. |
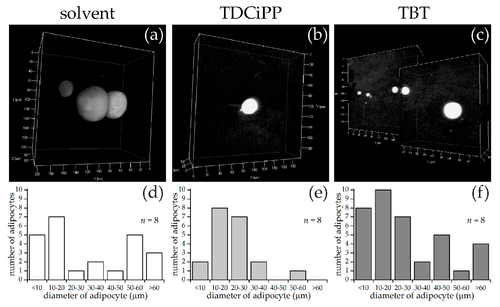
SRS imaging of adipocytes in fish exposed to environmental chemicals. (a–c) Representative images of volumes of SRS lipid measurements following solvent control (0.01% DMSO), 0.5 µM TDCiPP, or 1 nM TBT exposure, respectively; (d–f) Frequency of adipocytes in different size classes of solvent control (n = 8), TDCiPP (n = 8) or TBT (n = 8) respectively, determined by an automated image processing algorithm in MATLAB. |