
FIGURE
Fig. 8
- ID
- ZDB-FIG-180104-65
- Publication
- den Broeder et al., 2017 - Altered Adipogenesis in Zebrafish Larvae Following High Fat Diet and Chemical Exposure Is Visualised by Stimulated Raman Scattering Microscopy
- Other Figures
- All Figure Page
- Back to All Figure Page
Fig. 8
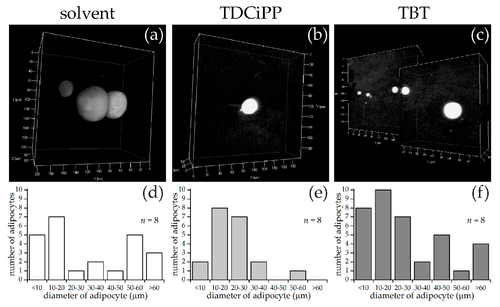
SRS imaging of adipocytes in fish exposed to environmental chemicals. (a–c) Representative images of volumes of SRS lipid measurements following solvent control (0.01% DMSO), 0.5 µM TDCiPP, or 1 nM TBT exposure, respectively; (d–f) Frequency of adipocytes in different size classes of solvent control (n = 8), TDCiPP (n = 8) or TBT (n = 8) respectively, determined by an automated image processing algorithm in MATLAB. |
Expression Data
Expression Detail
Antibody Labeling
Phenotype Data
Phenotype Detail
Acknowledgments
This image is the copyrighted work of the attributed author or publisher, and
ZFIN has permission only to display this image to its users.
Additional permissions should be obtained from the applicable author or publisher of the image.
Full text @ Int. J. Mol. Sci.