
- Title
-
In vivo flow mapping in complex vessel networks by single image correlation
- Authors
- Sironi, L., Bouzin, M., Inverso, D., D'Alfonso, L., Pozzi, P., Cotelli, F., Guidotti, L.G., Iannacone, M., Collini, M., Chirico, G.
- Source
- Full text @ Sci. Rep.
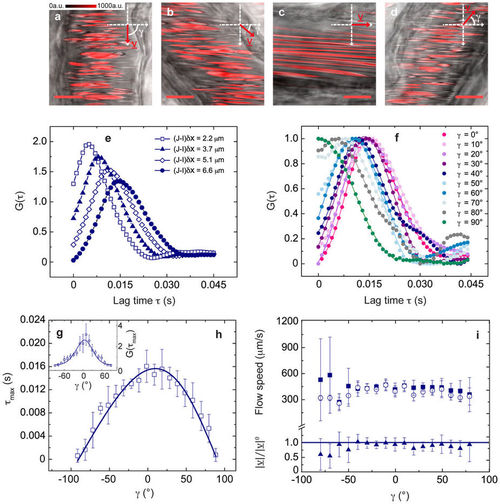
Validation measurements in Zebrafish embryos (3 days post fertilization d.p.f.). (a)–(d) Confocal xy-images acquired by detecting the fluorescence signal (shown in red) of DsRed-expressing RBCs (λexc = 561 nm, detection bandwidth = 575–650 nm), overlaid to (non-confocal) transmitted-light images. fline = 1000 Hz, δx = 0.04 μm, scale bar, 10 μm; γ = 90°, 50°, 0°, −50° in (a), (b), (c) and (d), respectively. γ and v are sketched in the reference Cartesian xy-plane. (e) Exemplifying experimental CCFs for increasing column distance, showing the expected decrease of the peak time for lower (J-I)δx values. (f) Normalized CCFs for γ ∈ [0°, 90°] and (J-I)δx = 6.6 μm, fitted to equation (3); errors are within the size of data points. (g), (h) Experimental CCF peak amplitude (in g) and peak time (in h) for γ ∈ [−90°, 90°] (mean ± standard deviation (s.d.), from n = 7 xy-images), fitted to equation (S.44) and equation (4) (derived in the approximation D = 0 in Supplementary Note 2). Best-fit parameters a = 6.3 ± 0.2 μm in (f) and |v| = 424 ± 11 μm/s in (g). (i) Flow speed |v| recovered from the CCFs fit (open circles, mean ± s.d., n = 4) and |v|0 recovered directly from the CCFs peak time (filled squares, weighted average ± s.d., n = 7). In the lower panel, |v|/|v|0 is shown for γ ∈ [−80°, 80°]. For γ = ± 90°, |v|0 has not been recovered since the CCF turns into a decay (see panel f). |

Measurement in time of the blood flow speed in the hepatic microcirculation. (a) xy-image acquired by detecting the photoluminescence (shown in white) of 5-nm QDs (λexc = 900 nm, detection bandwidth = 640–690 nm); fline = 850 Hz, δx = 0.051 μm, scale bar, 10 μm. CCFs have been derived on the evidenced ROIs (ROI 1: 240 × 210 pixels; ROI 2: 450 × 120 pixels; ROI 3: 145 × 250 pixels) for (J-I)δx = 0.5–2 μm and fitted (equation (3)), leading to |v| = 235 ± 4 μm/s, 235 ± 3 μm/s and 229 ± 8 μm/s for ROIs 1, 2 and 3, respectively. A color coding is assigned for the speed |v|, while the arrows indicate the flow direction. γ, fixed to 50°, −4° and 80° in ROIs 1, 2 and 3, is sketched in the reference xy-plane. (b), (c) The xy-image in (a) is one out of ten frames of an xyt-stack (Δt = ti + 1–ti = 0.88 s is the interval between the sampling of the same pixel in two consecutive frames i and i + 1). The first five frames, each identified by its sampling time ti = iΔt, are shown for ROIs 1 (b) and 2 (c). The same color code of panel (a) is adopted for the centreline. Scale bar, 5 μm; same calibration bar (in arbitrary units) in (b) and (c). (d), (e) Estimates for |v| (triangles) and |v|0 (squares) versus time in ROIs 1 (d) and 2 (e). The average ratio |v|/|v|0 is 0.92 and 0.95 in ROIs 1 and 2, respectively. |

Measurement of the blood flow speed in the hepatic microcirculation on a wide field of view. (a) xy-image acquired by detecting the photoluminescence (shown in white) of 5-nm QDs (λexc = 900 nm, detection bandwidth = 640–690 nm); the lower right corner corresponds to the same region analysed in Figure 3. fline = 627 Hz, δx = 0.102 μm, scale bar, 15 μm. CCFs have been derived on the selected ROIs (~ 100 × 50–200 × 100 pixels) for (J-I)δx = 0.51–2.55 μm; the estimated |v| and |v|0, recovered by the fit (equation (3)) and from the peak time (equation (4)) of the experimental CCFs, are reported in Table 1. (b) Schematic of the vessel centrelines for the image in (a). In each ROI, the arrow defines the flow direction and the color codes for the speed value |v|. Vessels not analysed are shown in grey. (c) CCFs computed for (J-I)δx = 2.04 μm in ROIs 5, 6 and 11 (errors are within the size of data points). The fit (equation (3)) led to |v| = 499 ± 18 μm/s in ROI 5, |v| = 187 ± 2 μm/s in ROI 6 and |v| = 396 ± 3 μm/s in ROI 11; as expected, the CCF peak shifts toward shorter lag times as the flow speed increases. |

Computation of CCFs on regions of interest of variable size (a) Raw, confocal raster-scanned xy-image acquired by detecting the emitted signal of the fluorescent protein DsRed expressed by erythrocytes in the posterior caudal cardinal vein of a 3 d.p.f. Zebrafish embryo (we note that it is not the same of Figure 2 in the main text). λexc = nm, detection bandwidth=575-650 nm, fline = 1400 Hz, δx = 0.08µm, γ = 0 °; scale bar = 10 µm intensity calibration bar on the right in arbitrary units. Starting from this 512x512 image, ROIs of variable size have been selected for the CCFs derivation, keeping the center of the regions of interest coincident with the center of the image. (b) Experimental CCFs computed on the largest useful ROI (512x274 pixels) selected in the image shown in a, for increasing column distances (J - I)=10, 30, 60, 90, 120, 150 pixels. The global fit, performed according to eq. (S.23), provides a flow speed |v|ref = 1260 ±3 µm/s. (c),(d) CCFs derived for J - I =60 pixels (panel c) and J - I=30 pixels (panel d), on ROIs having a fixed Ny=274 and a variable x-size in the range 31-512 pixels. (e) CCFs computed for a fixed column distance J - I = 30 pixels, on ROIs having a fixed x-size of 512 pixels and a variable y-size in the range 40-274 pixels. (f) A size reduction along the y-direction is combined to a reduction along the horizontal x-axis of the image: CCFs are shown for a fixed column distance J - I=30 pixels, a fixed ROI y‐size of 64 pixels and a variable x-size in the range 31-512 pixels. The effect produced by a reduction of the horizontal x-size of the region of interest is independent on the number of pixels along the vertical direction (see panel d for comparison): even for a small Ny=64, an average over ten pairs of columns provides sufficient statistics for the recovery of the CCF. (g) Estimates (filled squares) of the flow speed v obtained from the fit of the CCFs for J - I=60 pixels, shown in panel c: for a x-side between 70 and 512 pixels, the drift speed can be measured with a small discrepancy (|v|-|v|ref)/|v|ref = 0.02 with respect to the reference value (blue line) provided by the largest analyzed ROI. The estimates of the speed v (filled circles) provided by the global fit of the CCFs computed, for each of the ROIs, for increasing column distances in the range [10, (Nx− 10)] pixels (10-pixels step) are also shown for comparison (we remark the similarity with the strategy adopted throughout the whole main text for the speed measurement, based on multiple column distances and on the global fit of all the corresponding CCFs). (h) Uncertainty σG on the peak value of the CCF as a function of the number of cross-correlation functions averaged for each value of the ROI x-size. Data refer to Ny=64 and J - I=30 pixels (filled circles, pink), to Ny=274 and J - I=30 pixels (filled circles, blue) and to Ny=274 and J - I=60 pixels (open squares, blue). (j) Uncertainty σG on the peak value of the CCF as a function of the number of pixels Ny along the vertical side of the ROI, for a fixed Nx=512. |

Optimal intensity threshold for the computation of cross- correlation functions on xy-images (a) Raw raster-‐scanned xy-image acquired by detecting the photoluminescence signal of 5-nm Quantum Dots (QDs) (two-‐photon excitation at λexc =900 nm, detection bandwidth=640-690 nm) in a sinusoid of the hepatic microcirculatory system; fline= 1370 Hz, δx= 0.026 µm, scale bar= 3 µm; intensity calibration bar on the bottom in arbitrary units (a.u.). QDs appear as the brightest diagonal lines in the xy-image, separated by low-intensity diagonal stripes produced by non-fluorescent flowing red blood cells. Due to auto-fluorescence contributions and to the scattering processes that inevitably occur in a thick living biological sample, the separation of alternating streaks is rather unclear. Cross-correlation functions are better computed after a threshold has been applied to the intensity counts in the pixels of the xy-image. The threshold is inserted in the same Python code used for the computation of the CCFs: for each pixel, the detected intensity is unaltered if it exceeds the threshold and it is set to zero otherwise, so that the threshold defines a minimum photoluminescence intensity Fmin; if it is properly chosen, the background is effectively removed without altering the estimate of the blood flow speed recovered from the diagonal lines produced by QDs. (b)-(d) Three exemplifying threshold values are evaluated for the image of panel a: Fmin=1000 a.u. in b, 1528 a.u. in c and 2000 a.u. in d. The pixels in which the detected intensity exceeds the threshold Fmin (and that therefore remain unchanged for the computation of the CCFs) are uniformly green-colored; otherwise they are shown with the same LUT of panel a. For a too low threshold value (panel b) the background is not suppressed, whereas for a much higher value (panel d) too many pixels acquire a null intensity prior to the derivation of the CCFs. An intermediate, reasonable threshold is shown in panel c. (e) Histogram of the intensity counts for the image shown in a. The threshold Fmin=1528 a.u. adopted for panel c corresponds to the center xc=1528±9 a.u. of the histogram, as obtained from its Gaussian best fit (the first peak of the histogram is ascribed to the low intensity values detected outside the vessel and is therefore neglected). Inset: the threshold Fmin=1528 determined from the histogram is adopted to derive the experimental cross-correlation functions from the image in a for increasing column distances J - I in the range 10-90 pixels (10-pixels step). (f) Effect of various threshold values on experimental CCFs for the image in a. CCFs are computed for a fixed column distance J-I=100 pixels and for increasing threshold values in the range 0-2600 a.u.. The higher the threshold, the higher is the amplitude of the CCF and the more discernible is its peak; no variation in the peak lag time τmax is found, so that the flow speed measurement is not affected by the threshold: the global fit (eq. S.23) of six CCFs (1528 a.u.< Fmin < 2600 a.u.) provides a shared speed (|v|=494±3 µm/s for all the curves. Inset: CCFs are normalized to highlight the independence of the peak time τmax on the threshold value. The threshold only affects the width of the diagonal lines produced by flowing objects in the xy-image: the higher the adopted value for Fmin the thinner is each diagonal stripe (pixels on the border are more likely affected by the threshold) and this leads in turn to a reduced width of the recovered cross-correlation function. This effect can be quantified by the (narrow) range a=1.9-‐2.7 µm for the radius of flowing objects provided by the fits of the CCFs (we recall that, according to eq. S.23, the width of the CCF is directly proportional to the squared radius a2). Globally the previously adopted value Fmin=1528 a.u. allows a reliable computation of the cross-correlation functions (inset of panel e) without largely affecting the width of the CCFs (and the resulting estimates of the radius a and of the diffusion coefficient D of the flowing objects). (g)-(j) The choice and the effect of the threshold are tested on the image analysed extensively in Figure 3 (ROI 2, frame 5). Here even the CCFs computed with Fmin=0 a.u. allow the recovery of the blood flow speed and they provide therefore a reference value to validate the independence of the estimated speed |v| on the selected threshold value. (g) Raw raster-scanned xy-image (see acquisition parameters in Figure 3; calibration bar on the left in arbitrary units, scale bar, 5 µm) acquired by detecting the photoluminescence signal of 5-nm QDs. In the inset, the pixels having an intensity exceeding the chosen threshold Fmin=5855 a.u. (i.e, pixels kept unchanged for the computation of the CCFs) are uniformly green-colored. The threshold is assigned by the center of the histogram of the intensity counts (shown in h with its Gaussian fit) as previously discussed. (i),(j) Effect of various threshold values on experimental cross-correlation functions for the image in g. CCFs are computed for a fixed column distance J − I=20 pixels in i and for J - I=40 pixels in j, for increasing threshold values in the range 0-8300 a.u. (same color code in both panels). As before, the amplitude of the CCFs increases for increasing values of Fmin while the position of the peak time τmax remains unchanged. The global fit, performed according to eq. (S.23) on the two CCFs derived for a column distance (J − I) of 20 and 40 pixels with Fmin=0 a.u., leads to a speed |v| =242±8 µm/s, in agreement with the result |v| =235±3 µm/s obtained for Fmin=5855 a.u. (reported in Figure 3e). This also confirms that, even when not mandatory, the introduction of the threshold does not alter the obtained results. Inset: CCFs for J − I=20 pixels have been normalized to highlight the slight reduction of the correlation width for increasing Fmin and the independence of the peak time τmax on the threshold value. |

Intensity thresholds for the xy-images of Figures 3 and 4 (a) Raster-scanned xy-image reported in the main text as Figure 3, panel a. In ROIs 1-3, on which the cross-correlation analysis has been performed, pixels are uniformly green colored if they are unaltered upon the threshold introduction (i.e., if the detected photoluminescence intensity exceeds the adopted threshold); otherwise the same LUT of Figure 3a is adopted (calibration bar on the bottom in arbitrary units a.u.). Scale bar, 10 µm. In (b) and (c) subsequent time points for ROIs 1 (b) and 2 (c) are reported, as in Figure 3 b,c in the main text (scale bar, 5 µm). (d) Raster-scanned xy-image reported in the main text as Figure 4, panel a. Even in this case, in the ROIs on which CCFs have been computed the effect of the adopted threshold is highlighted by uniformly evidencing in green the pixels having a photo-luminescence intensity higher than the threshold. Scale bar, 15 µm. |