
|
Fig. S8
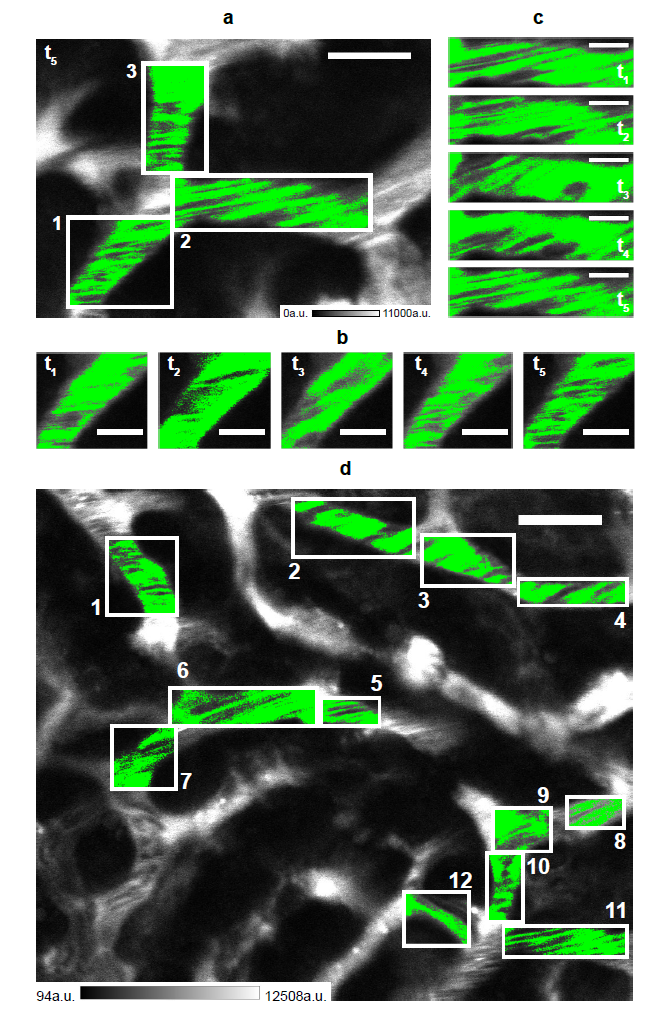
Intensity thresholds for the xy-images of Figures 3 and 4
(a) Raster-scanned xy-image reported in the main text as Figure 3, panel a. In ROIs 1-3, on which the cross-correlation analysis has been performed, pixels are uniformly green colored if they are unaltered upon the threshold introduction (i.e., if the detected photoluminescence intensity exceeds the adopted threshold); otherwise the same LUT of Figure 3a is adopted (calibration bar on the bottom in arbitrary units a.u.). Scale bar, 10 µm. In (b) and (c) subsequent time points for ROIs 1 (b) and 2 (c) are reported, as in Figure 3 b,c in the main text (scale bar, 5 µm). (d) Raster-scanned xy-image reported in the main text as Figure 4, panel a. Even in this case, in the ROIs on which CCFs have been computed the effect of the adopted threshold is highlighted by uniformly evidencing in green the pixels having a photo-luminescence intensity higher than the threshold. Scale bar, 15 µm.