
- Title
-
The tumor-associated YB-1 protein: new player in the circadian control of cell proliferation
- Authors
- Pagano, C., di Martino, O., Ruggiero, G., Guarino, A.M., Mueller, N., Siauciunaite, R., Reischl, M., Foulkes, N.S., Vallone, D., Calabrò, V.
- Source
- Full text @ Oncotarget
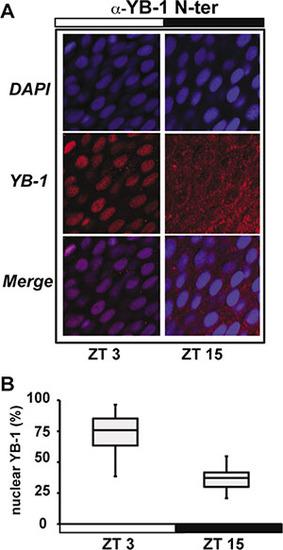
zfYB-1 cellular localization in zebrafish caudal fins. (A) Immunofluorescence analysis of zfYB-1 protein in the caudal fin at ZT3 (light phase) and ZT15 (dark phase) using α-YB-1 N-ter antibody. Panels also show DAPI staining and Merge, which combines both the DAPI and YB-1 signals. White and black bars indicate the corresponding lighting conditions. (B) Quantification of the panel A. EXPRESSION / LABELING:
|

ZFIN is incorporating published figure images and captions as part of an ongoing project. Figures from some publications have not yet been curated, or are not available for display because of copyright restrictions. EXPRESSION / LABELING:
|
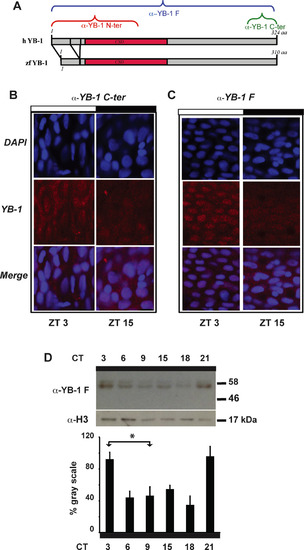
zfYB-1 protein expression in caudal fins. (A) Schematic representation of the human and zebrafish YB-1 proteins. Cold Shock Domains (red bars, CSD) and the portions recognized by the 3 antibodies, α-YB-1 N-ter, C-ter and F are indicated. (B, C) Immunofluorescence analysis of zfYB-1 protein in the caudal fin at ZT3 (light phase) and ZT15 (dark phase) using the α-YB-1 C-ter (B) and α-YB-1 F antibodies (C). Panel also shows DAPI staining and Merge, which combines both the DAPI and YB-1 signals. White and black bars above the panel indicate the corresponding lighting conditions. (D) Western blot analysis of zfYB-1 levels in fin nuclear extracts prepared during the second day in DD following transfer from LD cycle conditions. α−H3 was used for normalization. Quantification of western blot signals in panel D, was expressed as % of gray scale relative to the highest peak time point and plotted on the y-axes. CT times for each sample are plotted on the x-axis. Statistical significance is indicated above the graph by asterisks (*). White and black bars indicating the corresponding lighting conditions as well as the ZT (for LD) and CT (for DD) times are indicated above each panel. EXPRESSION / LABELING:
|
|
ZFIN is incorporating published figure images and captions as part of an ongoing project. Figures from some publications have not yet been curated, or are not available for display because of copyright restrictions. EXPRESSION / LABELING:
|