
Fig. S2
- ID
- ZDB-FIG-170309-5
- Publication
- Pagano et al., 2017 - The tumor-associated YB-1 protein: new player in the circadian control of cell proliferation
- Other Figures
- All Figure Page
- Back to All Figure Page
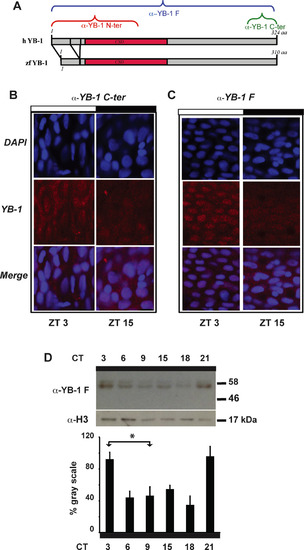
zfYB-1 protein expression in caudal fins. (A) Schematic representation of the human and zebrafish YB-1 proteins. Cold Shock Domains (red bars, CSD) and the portions recognized by the 3 antibodies, α-YB-1 N-ter, C-ter and F are indicated. (B, C) Immunofluorescence analysis of zfYB-1 protein in the caudal fin at ZT3 (light phase) and ZT15 (dark phase) using the α-YB-1 C-ter (B) and α-YB-1 F antibodies (C). Panel also shows DAPI staining and Merge, which combines both the DAPI and YB-1 signals. White and black bars above the panel indicate the corresponding lighting conditions. (D) Western blot analysis of zfYB-1 levels in fin nuclear extracts prepared during the second day in DD following transfer from LD cycle conditions. α−H3 was used for normalization. Quantification of western blot signals in panel D, was expressed as % of gray scale relative to the highest peak time point and plotted on the y-axes. CT times for each sample are plotted on the x-axis. Statistical significance is indicated above the graph by asterisks (*). White and black bars indicating the corresponding lighting conditions as well as the ZT (for LD) and CT (for DD) times are indicated above each panel. |
| Gene: | |
|---|---|
| Antibodies: | |
| Fish: | |
| Condition: | |
| Anatomical Terms: | |
| Stage: | Adult |