
- Title
-
A high-sensitivity, bi-directional reporter to monitor NF-κB activity in cell culture and zebrafish in real-time
- Authors
- Kuri, P., Ellwanger, K., Kufer, T.A., Leptin, M., Bajoghli, B.
- Source
- Full text @ J. Cell Sci.
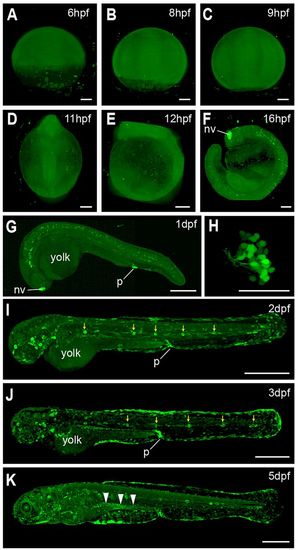
Dynamic NF-κB activity during early zebrafish embryonic development. (A–E) Light-sheet images of Tg(8×Hs.NFκB:GFP,Luciferase) embryos show ubiquitous, weak NF-κB activity from 6 hpf until 12 hpf. (F) The first strong tissue-specific signal was observed in the nasal vesicle (nv) at around 16 hpf. (G–K) Confocal images of Tg(8×Hs.NFκB:GFP,Luciferase) embryos from 1 dpf until 5 dpf. GFP was detected in the proctodeum (p) at 1 dpf (G). The GFP signal in the nasal vesicle (G) originates from microvillous sensory neurons (H). E–G and I–K show embryos in lateral view. Anterior is to the left. H shows the head of embryos from the frontal side. Yellow arrows indicate GFP in the lateral line. White arrowheads indicate GFP in the intestine. Scale bars: 100 µm (A–F); 300 µm (G); 50 µm (H); 500 µm (I–K). |
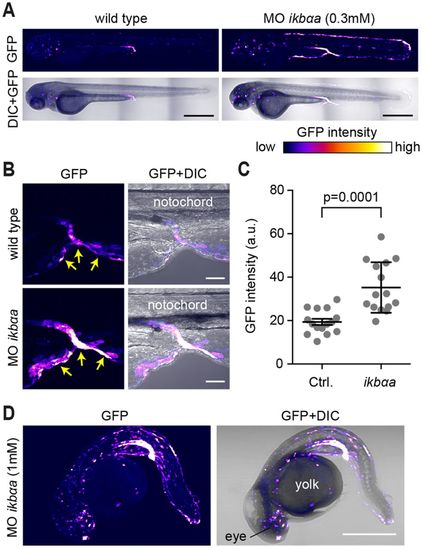
Specificity of Tg(8xHs.NFκB:GFP,Luciferase) for NF-κB activity in zebrafish embryos. (A,B) 0.3 mM iκbαa morpholino was injected into transgenic embryos. Morphants at 3 dpf had increased expression of GFP in the skin (A) and proctodeum (B, arrows). GFP fluorescence is shown as a false-color heat map. The intensity of the laser was equal for both images to allow direct comparison of the GFP signal in morphants and controls. (C) Quantitative comparison of the GFP signal in the proctodeum of embryos injected with 0.3 mM standard control or iκbαa morpholino. Each dot represents an individual embryo at 2 dpf (mean±s.d.). (D) Injection of 1 mM iκbαa morpholino results in higher GFP expression and embryonic malformation. GFP fluorescence is shown as a heat map as indicated in A. Scale bars: 500 µm (A); 50 µm (B); 300 µm (D). |
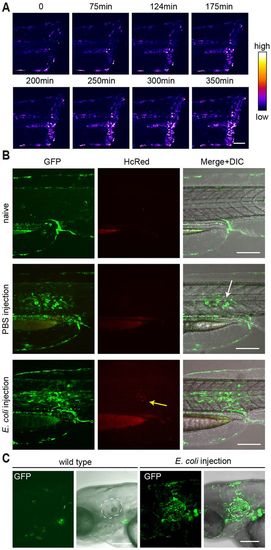
In vivo visualization of NF-κB activity upon local wounding and infection. (A) Time-lapse images derived from Movie 2 show NF-κB activation after tailfin cut. GFP fluorescence in the top panel is shown as a heat map. GFP is upregulated locally near the wound. (B,C) Injection of HcRed-expressing E. coli into the notochord (B) or inner ear (C) of Tg(8×Hs.NFκB:GFP,Luciferase) elicits NF-κB activation 20 h after infection. The bacterial infection results in the accumulation of immune cells in the inner ear. GFP was not expressed in the notochord or inner ear of uninfected control zebrafish. The white dashed line in (C) demarcates the inner ear. Anterior is to the left. Scale bars: 150 µm (A,C); 200 µm (B). |
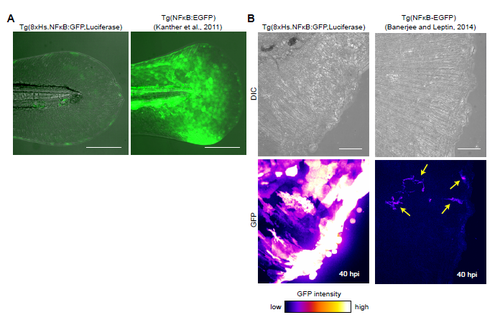
Comparison between Tg(8xHs.NFκB:GFP,Luciferase) and two other previously developed zebrafish NF-κB-responsive transgenic lines. (A) Tg(NFκB:EGFP) embryos display stronger GFP signal in the skin compared to the Tg(8xHs.NFκB:GFP,Luciferase) embryos at 3dpf. Note the Tg(NFκB:EGFP) line was originally described in Kanther et al., 2011. (B) Comparison between Tg(8xHs.NFκB:GFP,Luciferase) and Tg(NFκB-EGFP) after tailfin cut. The GFP was examined 40 hours post-injury (hpi). Note equal laser intensity was used to illustrate that Tg(NFκB-EGFP) embryos display weaker GFP signal in the injured site compared to the Tg(8xHs.NFκB:GFP,Luciferase) embryos. Yellow arrows indicate cells with GFP expression. Note Tg(NFκB-EGFP) line was originally described in Banerjee and Leptin, 2014. Anterior is to the left. Scale bars: 200μm (A) and 30μm (B). |
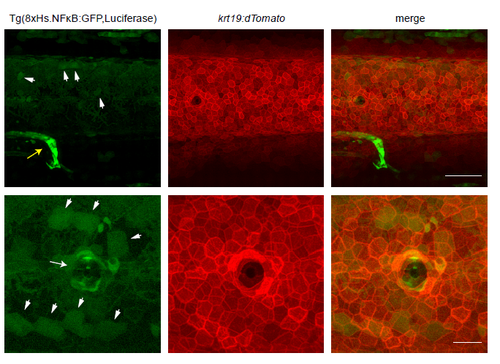
NF-κB activity in the skin of zebrafish embryos at 4dpf. Trunk region of a Tg(8xHs.NFκB:GFP,Luciferase [green]; krt19:dTomato [red]) embryo at 4dpf illustrating the sporadic NF-κB activity in the basal keratinocytes (arrowheads). Note krt19 is mainly expressed in the basal keratinocyte layer (Fischer et al., 2014). Yellow arrow indicates GFP expression in the proctodeum. White arrows indicate GFP expression in cells surrounding the lateral line. Anterior is to the left. Scale bars: 100μm (top panel) and 30μm (bottom panel). |

Expression pattern of iκbαa and iκbαb in zebrafish embryos. Wholemount RNA in situ hybridization of iκbαa (A-D) and iκbαb (E-H) in zebrafish embryos at 2-3dpf. A-C, E-G show lateral views. Anterior is to the right. D and H show the head of embryos from the dorsal side. Black arrows indicate expression in the proctodeum. Red arrows indicate expression in the lateral line. Black arrowheads indicate iκbαa expression in the nasal vesicle. EXPRESSION / LABELING:
|