
|
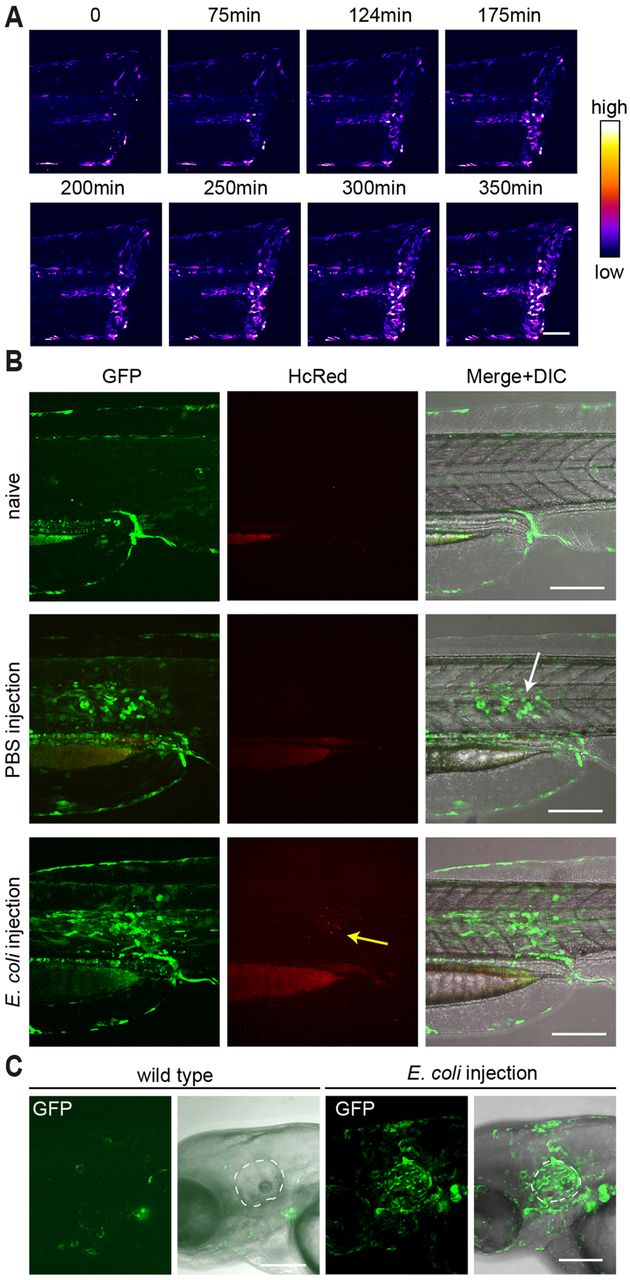
Fig. 6
In vivo visualization of NF-κB activity upon local wounding and infection. (A) Time-lapse images derived from Movie 2 show NF-κB activation after tailfin cut. GFP fluorescence in the top panel is shown as a heat map. GFP is upregulated locally near the wound. (B,C) Injection of HcRed-expressing E. coli into the notochord (B) or inner ear (C) of Tg(8×Hs.NFκB:GFP,Luciferase) elicits NF-κB activation 20 h after infection. The bacterial infection results in the accumulation of immune cells in the inner ear. GFP was not expressed in the notochord or inner ear of uninfected control zebrafish. The white dashed line in (C) demarcates the inner ear. Anterior is to the left. Scale bars: 150 µm (A,C); 200 µm (B).