
|
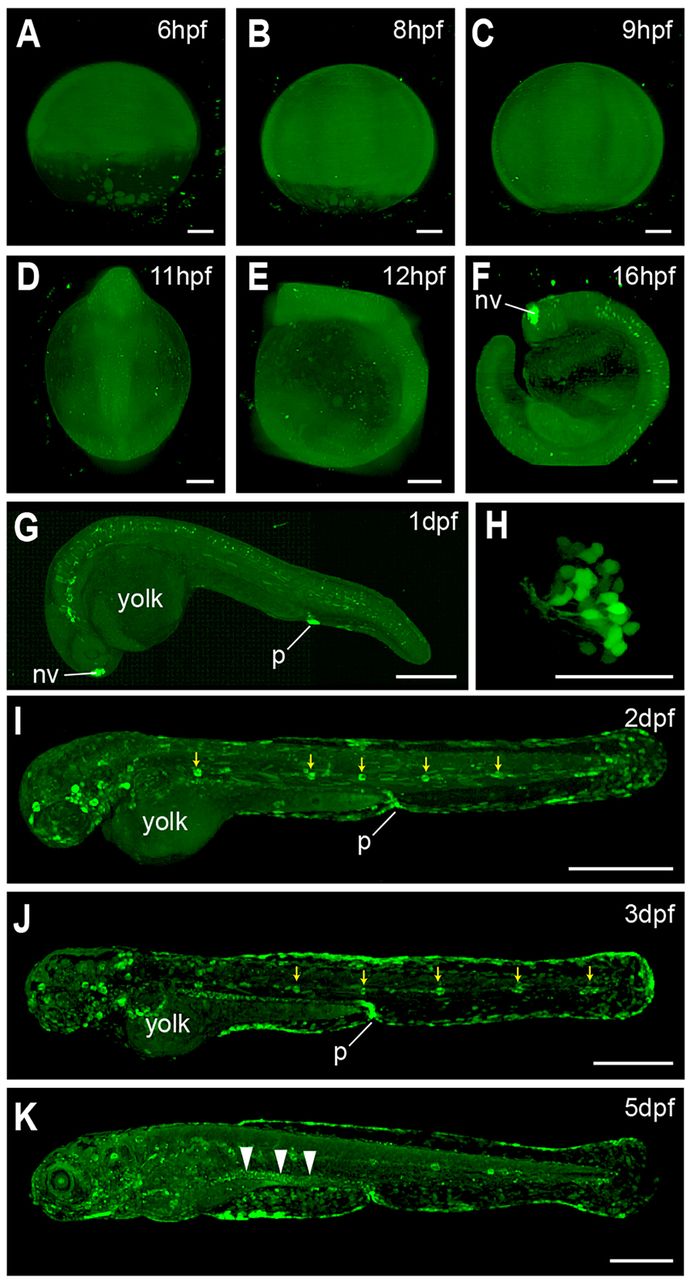
Fig. 4
Dynamic NF-κB activity during early zebrafish embryonic development. (A–E) Light-sheet images of Tg(8×Hs.NFκB:GFP,Luciferase) embryos show ubiquitous, weak NF-κB activity from 6 hpf until 12 hpf. (F) The first strong tissue-specific signal was observed in the nasal vesicle (nv) at around 16 hpf. (G–K) Confocal images of Tg(8×Hs.NFκB:GFP,Luciferase) embryos from 1 dpf until 5 dpf. GFP was detected in the proctodeum (p) at 1 dpf (G). The GFP signal in the nasal vesicle (G) originates from microvillous sensory neurons (H). E–G and I–K show embryos in lateral view. Anterior is to the left. H shows the head of embryos from the frontal side. Yellow arrows indicate GFP in the lateral line. White arrowheads indicate GFP in the intestine. Scale bars: 100 µm (A–F); 300 µm (G); 50 µm (H); 500 µm (I–K).