
- Title
-
Dysferlin-mediated phosphatidylserine sorting engages macrophages in sarcolemma repair
- Authors
- Middel, V., Zhou, L., Takamiya, M., Beil, T., Shahid, M., Roostalu, U., Grabher, C., Rastegar, S., Reischl, M., Nienhaus, G.U., Strähle, U.
- Source
- Full text @ Nat. Commun.
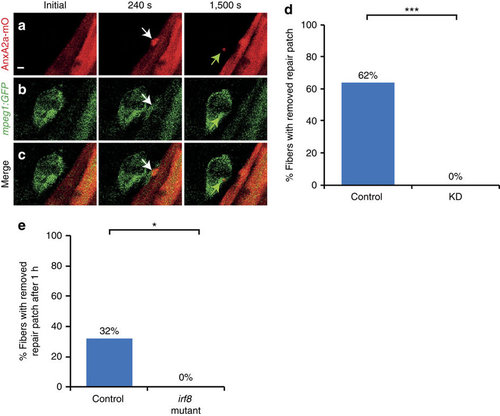
Macrophages remove repair patch. (a-c) Repair patch (AnxA2a-mO, a, white arrow) and macrophages (mpeg1:GFP, b, white arrows) before (Initial), 240 s and 1,500 s after wounding. A macrophage ingests parts of repair patch (green arrows). (c) Merged views of a,b. Note the bleed-through of AnxA2a-mO into the GFP channel (b). (d) Repair patch removal in control (left, n=37) and macrophage-depleted embryos (KD, right, n=25, Fisher’s exact test P<10-8) over 20 h. (e) Crispr/Cas9 knock-out of irf8 impairs repair patch removal. In controls, the repair patch was removed in 32% of injured myofibers (n=19) within one hour after injury. In the irf8-KO embryos the patch was present in all cases of injured myofibers examined (n=15). This suggests that morpholino triple knock-down is inefficient and the same effect on macrophages can be achieved by elimination of irf8 at the stage analysed. Significance was checked with Fishers exact test at P<0.05 (P=0.023895). Scale bar, 4 µm. EXPRESSION / LABELING:
PHENOTYPE:
|
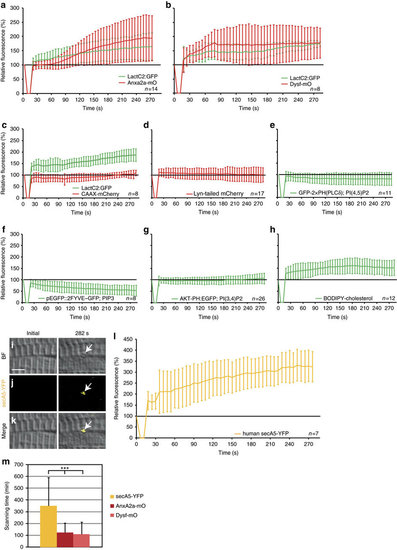
Phosphatidylserine (PS) is sorted to the repair patch. (a-h) Real-time analysis of enrichment of PS (LactC2:GFP (a-c)), PI(4,5)P2 (GFP-2 × PH(PLC´) (e)), PIP3 (pEGFP::2FYVE–GFP (f)), PI(3,4)P2 (AKT-PH:EGFP (g)) and cholesterol (BODIPY-cholesterol (h)), relative to AnxA2a-mO (a), Dysf–mO (b) and membrane markers CAAX-mCherry (c), Lyn-tailed mCherry (d). The reporter fluorescence is expressed as percentage (mean±s.d.) relative to the level before injury. (i-m) PS is presented on the extracellular side of the repair patch. (i–l) Extracellularly supplied secA5-YFP was enriched at membrane on lesioning (i–k, arrows). secA5-YFP expressing myofibers are outside of the field of view. (l) Kinetics of secA5-YFP at the repair patch. (m) Macrophage scanning-time (+/ s.d.) of myofibers expressing secreted secA5-YFP (yellow, n=19), AnxA2a-mO (dark red, n=22) or Dysf–mO (light red, n=23; Student t-test P<0.001) Scale bar, 4 µm. |
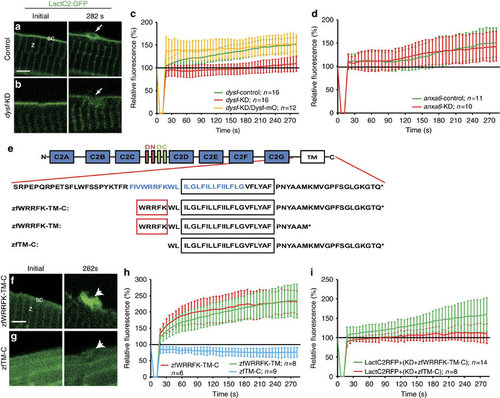
Five amino acid motif in Dysf is required for PS accumulation. (a,b) Before wounding, LactC2:GFP (green) localized to the sarcolemma (sc; a) and the Z-line (z; a) both in control (a) and knock-down (dysf-KD; b) myofibers. On injury, LactC2:GFP accumulated in controls (a, arrow) but not in dysf-KD myofibers (b, arrow). (c) Kinetics of LactC2:GFP accumulation in control-KD (green), dysf-KD (red) and dysf-KD embryos co-injected with mOrange1-DysfC (Dysf-mO, yellow). Lack of PS accumulation in dysf-KD myofibers was rescued by Dysf-mO, translation of which is not inhibited by dysf morpholino. (d) Knock-down of anxa6 (anxa6-KD) had no effect on PS accumulation (red) compared with controls (anxa6-control, green). (e) Domain structure of Dysf. (blue AA: predicted amphipathic helix). (f,g), On damage zfWRRFK-TM-C accumulates in the repair patch (f, arrow). No accumulation was observed for zfTM-C (g, arrow). (h) Accumulation kinetics of zfWRRFK-TM-C (red), zfWRRFK-TM (green) and zfTM-C (blue). A 5-AA motif (WRRFK, red box, e) is required for accumulation. (i) zfWRRFK-TM-C (red) but not zfTM-C (green) rescued PS accumulation in dysf-KD myofibers. In all charts, the change of fluorescence at the lesion is indicated as percentage relative to the undamaged state±s.d.). Scale bars, 4 µm (a,g-h), 3 µm (b). |
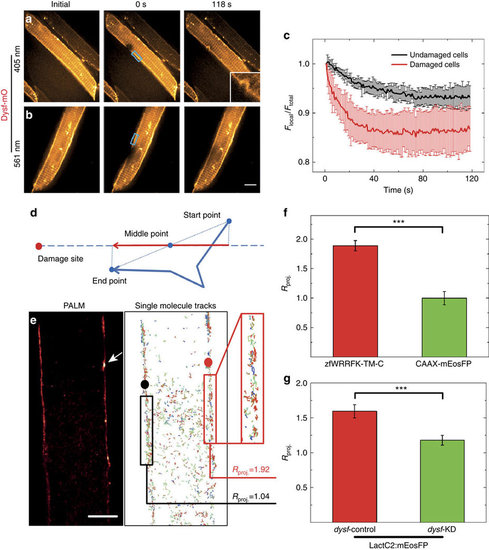
Dysf facilitates PS translocation to site of lesion. (a-c) Fluorescence loss in photobleaching (FLIP) analysis on selected regions (blue boxes in a,b) of live Dysf-mO expressing myofibers. (a) Photobleaching and membrane damaging using 405 nm laser; (b) photobleaching only using 561 nm laser. (c) 561-nm irradiation results in an intensity decrease by 6% (black curve); 405-nm irradiation results in a more rapid decrease by 14% (red curve). (d-g) Single-molecule trajectory analysis of zfWRRFK-TM-C and controls after sarcolemmal damage. (d) Scheme showing the projection of a single-molecule trajectory onto the line connecting the midpoint with the site of damage. (e) Super-resolution localization image of a mEosFP:zfWRRFK-TM-C labelled myofiber. The arrow indicates the site of lesion. Single-molecules trajectories calculated from the image data in e. Molecules near the lesion (red box) show a high tendency (Rproj.=1.92) to move towards the lesion (red dot). In the undamaged sarcolemma (left), trajectories (black box) did not show directed motion towards the black dot (Rproj.=1.04). (f) mEosFP:zfWRRFK-TM-C moved towards the lesion (red column); the control CAAX-mEosFP did not (green column; P<10-8). (g) The PS sensor LactC2:mEosFP moved towards the lesion in dysf-contr-KD embryos (red column) but not in dysf-KD embryos (green column; Student t-test P<10-8). n≥ 8. Scale bar, 5 µm. |
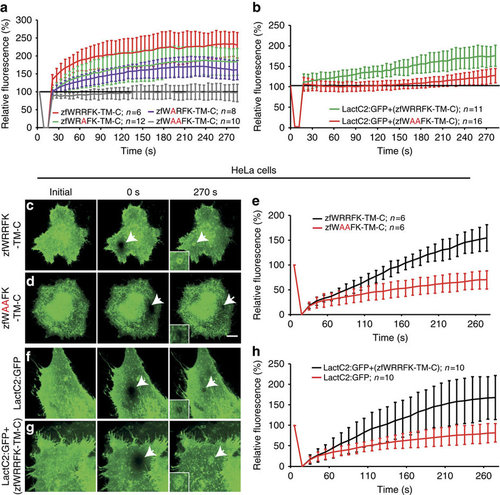
The WRRFK-motif is required for accumulation of Dysf and PS. (a) After membrane damage, zfWRRFK-TM-C (red) but not zfWAAFK-TM-C (grey) accumulated rapidly at the lesion. The effect was reduced on exchange of the first (zfWARFK-TM-C; purple) or second arginine by alanine (zfWRAFK-TM-C; green). (b) PS (LactC2:GFP) enrichment in the repair patch of Dysf-KD myofibers co-expressing zfWRRFK-TM-C (green), but not of those co-expressing zfWAAFK-TM-C (red). (c-e) HeLa cells expressing zfWRRFK-TM-C were imaged before (c) and 0 s (c, arrow) and 270 s after membrane damage (c, arrows). zfWRRFK-TM-C markedly amassed at the lesion (c, arrow, inset; e, black), whereas zfWAAFK-TM-C showed only baseline fluorescence recovery after photobleaching (d, arrows, inset; e, red). (f-h) HeLa cells transfected with LactC2:GFP and imaged before (f) and 0 s (arrow) and 270 s after lesioning (arrow) showed no PS accumulation but only baseline recovery (f, arrow, inset; h, red); in the presence of zfWRRFK-TM-C, LactC2:GFP accumulated within the repair patch (g, arrows, inset; h, black). The data in (a,b,e,h) are given as mean±s.e.m. (n=>5) and scaled such that 100% corresponds to fluorescence from the same area before damaging. Scale bars, 10 µm (c,d) and 12.86 µm (f,g). |
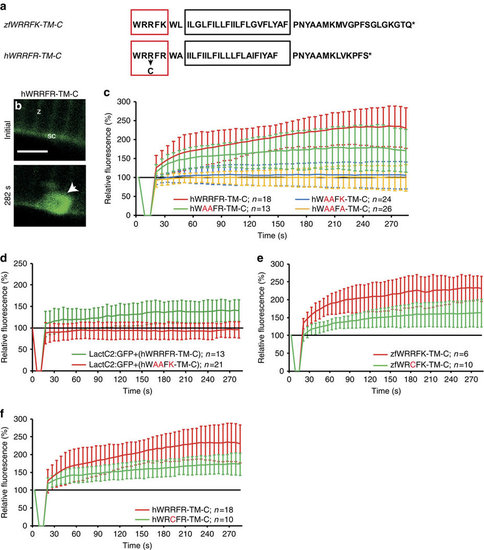
Arginine-rich motif is mutated in myopathy patients. (a) Zebrafish zfWRRFK-TM-C and human hWRRFR-TM-C (red box arginine-rich motif; black box: TM domain, arrow: R2042C mutation). (b,c), hWRRFR-TM-C localized to the Z-line (z) and sarcolemma (sc) before damage (b). On damage, it accumulated at the lesion (b, arrow; c, red). In contrast, hWAAFK-TM-C (c, blue) and hWAAFA-TM-C (c, yellow) mutants did not accumulate and hWAAFR-TM-C caused significantly reduced accumulation (c, green). (d) LactC2:RFP accumulated in Dysf-KD myofibers when hWRRFR-TM-C (green) but not when mutant hWAAFK-TM-C (red). was co-expressed. (e,f) zfWRCFK-TM-C (e, green) and hWRCFR-TM-C (f, green), modelling the R2042C dysferlinopathic mutation showed significantly reduced accumulation (red). The fluorescence intensity of Dysf reporters at lesion relative to levels before damage is expressed as mean±s.d. (n≥6). Note that the control data on hWRRFR-TM-C (c,f) are identical. Similarly, zfWRRFK-TM-C data (e) are also shown in Figs 3h and 5a. Scale bar, 4 µm. |
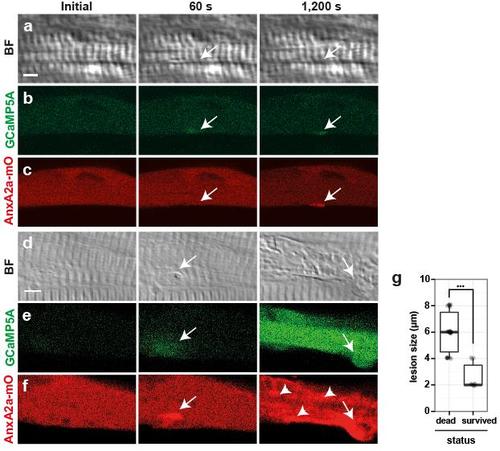
Fate of myofibers depends on size of membrane wound. a-f, Myofibers with a lesion (arrows) of either ≤4 µm (a-c) or ≥4 µm (d-f) were analyzed for repair patch formation (AnxA2a-mO, c, f), local Ca2+ changes (GCaMP5A, b, e) and corresponding bright field views (BF, a, d), prior to (initial), 60 s and 1,200 s after wounding. Immediately after wounding, GCaMP5A was locally activated regardless of the lesion size (b, e). Ca2+ levels at lesions of ≤ 4 µm size resolved back to baseline after 1,200 s with the exception of Ca2+ in the repair patch (b), however, lesions ≥4 µm led to propagation of a Ca2+ wave across the entire cell (e), frequently followed by sliding of the repair patch along the myofiber (arrow, d-f), and precipitation of AnxA2a-mO to internal membranes of myofibers (f, arrowheads), a hallmark of cell death. g, Survival rate of myofibers was analyzed as a function of initial lesion size (Y-axis in µm). Myofibers with lesions ≥4 µm underwent cell death (left column; n=30), while cells with lesions ≤4 µm survived (right column: n=10; Student’s t-test, p<0.001). Scale bar: 4 µm. |
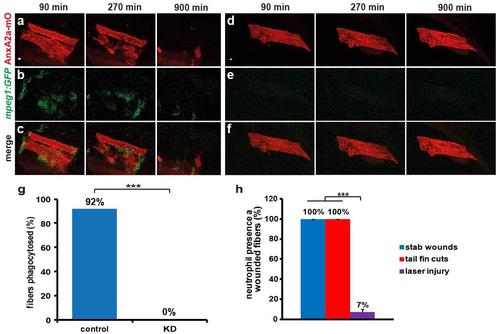
Macrophages remove severely damaged myofibers. a-f, Dead myofibers show precipitation of AnxA2a-mO (red) to internal membranes (a and d). In controls dead myofibers were removed by attracted macrophages (b, green) within 900 min after wounding (c). In morphants dead myofibers persisted beyond imaging time (d and f), due to the absence of macrophages (e). Panels a-b and d-e were merged in c and f, respectively. g, Macrophages remove dead myofibers. In controls (left, n=12), 92% of dead myofibers were removed by macrophages within 20 h of observation. In contrast, removal of dead cells (right, n=20) was totally abolished (0%) in animals lacking macrophages. h, Neutrophils were barely recruited to wounds inflicted with a laser (purple, n=126) while stab wounds caused by insertion of a glass needle into the somitic musculature (blue, n=23) and cutting of the tail fin (red, n=12) attracted neutrophils in all cases. Thus infection and concomitant differences in inflammatory status may have a bearing on which immune cells become engaged. Data was analyzed as maximum projections. p-values were calculated according to Fisher’s exact test, p<0.001. Scale bars: 4 µm. |
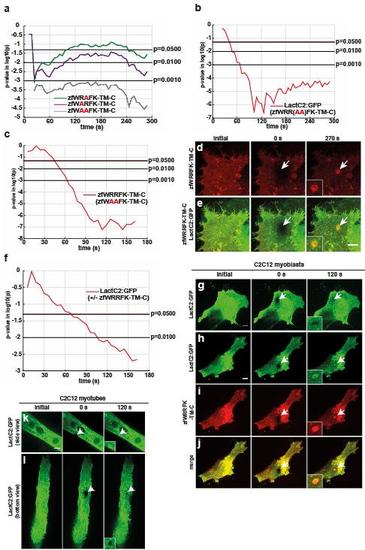
Two arginines within the zfWRRFK motif of Dysf are essential for PS and Dysf accumulation. a, Significance was tested comparing wild type constructs (zfWRRFK-TM-C) with single arginine to alanin substituted mutant constructs zfWRAFK-TM-C (green) and zfWARFK-TM-C (purple). The latter shows significant differences to the control throughout the whole imaging time, whereas zfWRAFK-TM-C showed significant differences in the first 100 s and turned again significant after 240 s. A double alanin mutant construct (zfWAAFK-TM-C, grey) showed significant disparity to the control throughout the whole imaging time. b, Significance was tested for LactC2:GFP enrichment at the lesion between co-injections of LactC2:GFP and zfWRRFK-TM-C or LactC2:GFP and zfWAAFK-TM-C. Significant disparity can be seen from 40 s until the end of imaging (red). c, Significance blot of HeLa cells either transfected with zfWAAFK-TM-C or zfWRRFK-TM-C. The latter accumulates significantly more from 45 s onwards (red). d-e, HeLa cells were co-transfected with LactC2:GFP (see Fig. 5g) and zfWRRFK-TM-C-mCherry. The damaged site is indicated by white arrows. Cells were imaged initially , directly after damage (0 s) and after 270 s. Accumulation of zfWRRFK-TM-C-mCherry was observed (d, inlay) and co-localization with LactC2:GFP is indicated by the yellow repair patch (e, inlay). Panels in e are merged images of d and Fig. 5g. f, After 70 s enrichment of PS at the membrane wound in co-transfected (LactC2:GFP and zfWRRFK-TM-C) cells differs significantly from single transfected (LactC2:GFP) cells (red). g-j, undifferentiated C2C12 myoblasts transfected with LactC2:GFP alone and imaged before 0 s (arrow) and 120 s after lesioning (arrow) showed no PS accumulation but only baseline recovery (i, arrow, inset). In the presence of zfWRRFK-TM-C, LactC2:GFP accumulated in the repair patch (j-l, arrows, insets). k-l, differentiated C2C12 myotubes (k, side view; l, bottom view) expressing LactC2:GFP only and imaged before 0 s (arrow) and 120 s after lesioning (arrow) showed PS enrichment at the lesion site (i, arrow, inset). Note: Experiments used to test significance (zfWRRFK-TM-C) in chart a are the same as used in Supplementary Fig. 3g. Significance was tested using MATLAB software. In charts (a-c and f) the two sided Welch’s t-Test with Bonferroni correction was performed. Scale bars: 10 µm. |