
- Title
-
Expression profiling identifies Sertoli and Leydig cell genes as Fsh targets in adult zebrafish testis
- Authors
- Crespo, D., Assis, L.H., Furmanek, T., Bogerd, J., Schulz, R.W.
- Source
- Full text @ Mol. Cell. Endocrinol.
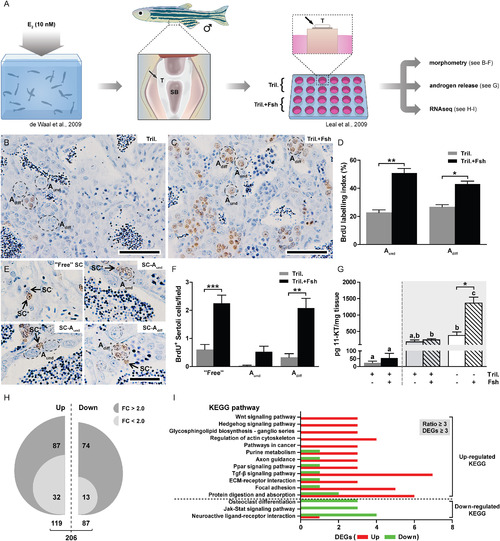
Proliferation and transcriptomic response of zebrafish testis to Fsh. (A) Schematic representation of the experimental set-up used in this study. Testis tissue was collected from adult males exposed to 10 nM estradiol (E2) in vivo for 21 days, to induce androgen insufficiency. Testicular explants were cultured for 48 h in the absence or presence of 100 ng/mL Fsh, co-incubated with 25 µg/mL trilostane to prevent the production of 3-keto,delta-4 steroids, and then used for different purposes. (B-C) Immunocytochemical detection of BrdU incorporation served to quantify germ cell proliferation activity. (D) Quantification of BrdU labeling indices of type Aund and type Adiff spermatogonia (n = 4). (E-F) Immunocytochemical detection of BrdU in Sertoli cells (E) and quantification of BrdU-positive Sertoli cells per section surface area (F) (n = 4). (G) Quantification of testicular androgen (11-KT) production to evaluate the effects of E2-pretreatment and/or trilostane. Males were pre-exposed (white background) or not (grey background) to 10 nM E2in vivo for 21 days and testes were then incubated in the absence or presence of 100 ng/mL Fsh with medium that did or did not contain 25 µg/mL of trilostane (n = 11-12). Incubation medium was collected after 48 h of culture and 11-KT levels determined by RIA. (H) Total numbers of up- (left) and down-regulated genes (right) identified by RNAseq. Numbers of differentially expressed genes (DEGs; 1-PNOI < 0.05) are shown in two categories after fold change (FC) selection (FC > 2.0, dark grey background; or < 2.0, light grey). (I) KEGG pathways modulated in Fsh-treated testes. Each pathway shown is represented by at least 3 DEGs (1-PNOI < 0.05) and has a ratio of regulated genes (up-/down-, or vice versa) higher than 3. DEGs are highlighted with red (up-) or green (down-regulated) background. In D, F and G, data are expressed as mean ± SEM and asterisks indicate significant differences between treated and control groups (*P < 0.05, **P < 0.01, ***P < 0.001). In G, bars with different letters are significantly different. Aund, type A undifferentiated spermatogonia; Adiff, type A differentiating spermatogonia; SB, swim bladder; SC, Sertoli cell; T, testis; Tril., trilostane. Scale bar represents 25 µm. (For interpretation of the references to colour in this figure legend, the reader is referred to the web version of this article.) PHENOTYPE:
|
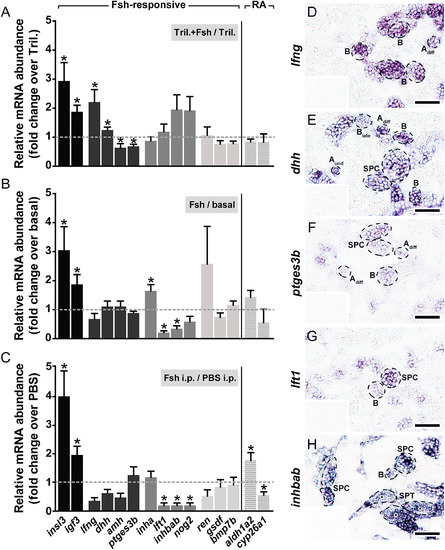
Expression behavior and mRNA localization of candidate genes modulated by Fsh in zebrafish testis. The mRNA abundance of selected genes identified using RNAseq approach was investigated by qPCR in testes cultured for 48 h in the absence or presence of Fsh (100 ng/mL) and co-incubated (A) or not (B) with 25 µg/mL trilostane (Tril.), as well as in testes collected 4 h after intraperitoneal (i.p.) injection of Fsh (100 ng/g body weight) (C). In addition, the expression of 2 retinoic acid (RA)-related enzymes was analyzed (separated by a vertical line). Adult males considered for this set of experiments were not pre-exposed to E2in vivo. Data are shown as mean of fold change ± SEM (n = 7-12) and expressed relative to the control condition, which is set at 1 (dashed line). Asterisks indicate significant differences between treated and control groups (P < 0.05). (D-H)In situ localization of candidate mRNA expression in zebrafish testis. Representative types of germ cell cysts are encircled and labeled. No specific staining was observed with sense cRNA probes (insets). Aund, type A undifferentiated spermatogonia; Adiff, type A differentiating spermatogonia; B, type B spermatogonia; SPC, spermatocytes; SPT, spermatids (indicated by an inner asterisk in panel H). Scale bar represents 25 µm. |
Reprinted from Molecular and Cellular Endocrinology, 437, Crespo, D., Assis, L.H., Furmanek, T., Bogerd, J., Schulz, R.W., Expression profiling identifies Sertoli and Leydig cell genes as Fsh targets in adult zebrafish testis, 237-251, Copyright (2016) with permission from Elsevier. Full text @ Mol. Cell. Endocrinol.