
- Title
-
Lactoferrin Decreases the Intestinal Inflammation Triggered by a Soybean Meal-Based Diet in Zebrafish
- Authors
- Ulloa, P.E., Solís, C.J., De la Paz, J.F., Alaurent, T.G., Caruffo, M., Hernández, A.J., Dantagnan, P., Feijóo, C.G.
- Source
- Full text @ J Immunol Res
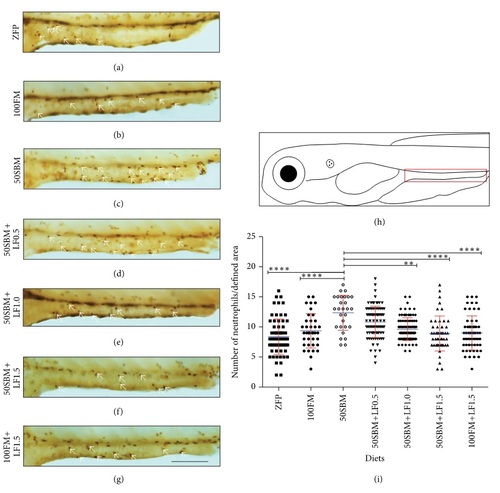
Effect of different lactoferrin doses on neutrophil migration to the intestine. (a-g) Lateral view of mid and posterior intestine of Tg(BACmpo:GFPi114 larvae of 9 dpf after four days of feeding with different diets (ZFP, 100FM, 50SBM, 50SBM+LF0.5, 50SBM+LF1.0, 50SBM+LF1.5, and 100FM+LF1.5). Neutrophils were quantified through immunohistochemistry against GFP (white arrows). (h) Larva scheme with the intestinal region of interest demarcated with a red rectangle. (i) The experiments were conducted with at least 28 larvae per treatment in three different assays. Statistical analysis was performed by comparing data sets with the 50SBM diet through one-way ANOVA. The graph is a representation of three different results. **P < 0.01; ***P < 0.0001. Bar scale = 200 µm. PHENOTYPE:
|

ZFIN is incorporating published figure images and captions as part of an ongoing project. Figures from some publications have not yet been curated, or are not available for display because of copyright restrictions. |
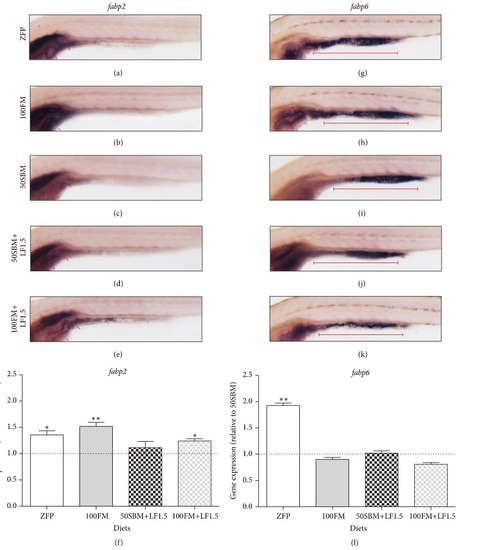
Effect of lactoferrin on lipid absorption markers. (a-e) fabp2 and (g-k) fabp6 mRNA expression pattern was analyzed by whole-mount in situ hybridization. Lateral view of larvae of 9 dpf after four days of feeding with different diets (ZFP, 100FM, 50SBM, 50SBM+LF1.5, and 100FM+LF1.5). (a-e) fabp2 expression was restricted to anterior intestine (red dotted line). (g-k) fabp6 expression was observed in the whole intestine, with a stronger expression in the mid and posterior gut (red continued line). (f and l) The transcriptional levels of fabp2 and fabp6 were quantified by qPCR. Data were normalized with β-actin and rpl13α and compared to 50SBM diet (dotted line). *P < 0.05; **P < 0.01. |
|
ZFIN is incorporating published figure images and captions as part of an ongoing project. Figures from some publications have not yet been curated, or are not available for display because of copyright restrictions. |
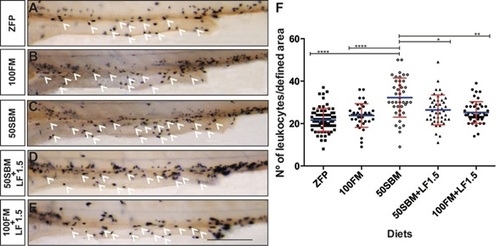
Effect of lactoferrin on the amount of leukocytes present in the intestine. Sudan Black B staining was performed on 9dpf larvae, after four days of feeding with different diets (ZFP, 100FM, 50SBM, 50SBM+LF1.5, 100FM+LF1.5). (A-E) Lateral view of intestines, white arrowhead indicates leukocytes. (F) The experiments were conducted with at least 28 larvae per treatment in three different assays. Statistical analysis was performed by comparing data sets with the 50SBM diet through one-way ANOVA.The graph is a representation of three different results. *P < 0.05; **P < 0.01; ****P < 0.0001. Bar scale = 200 µm. |