
|
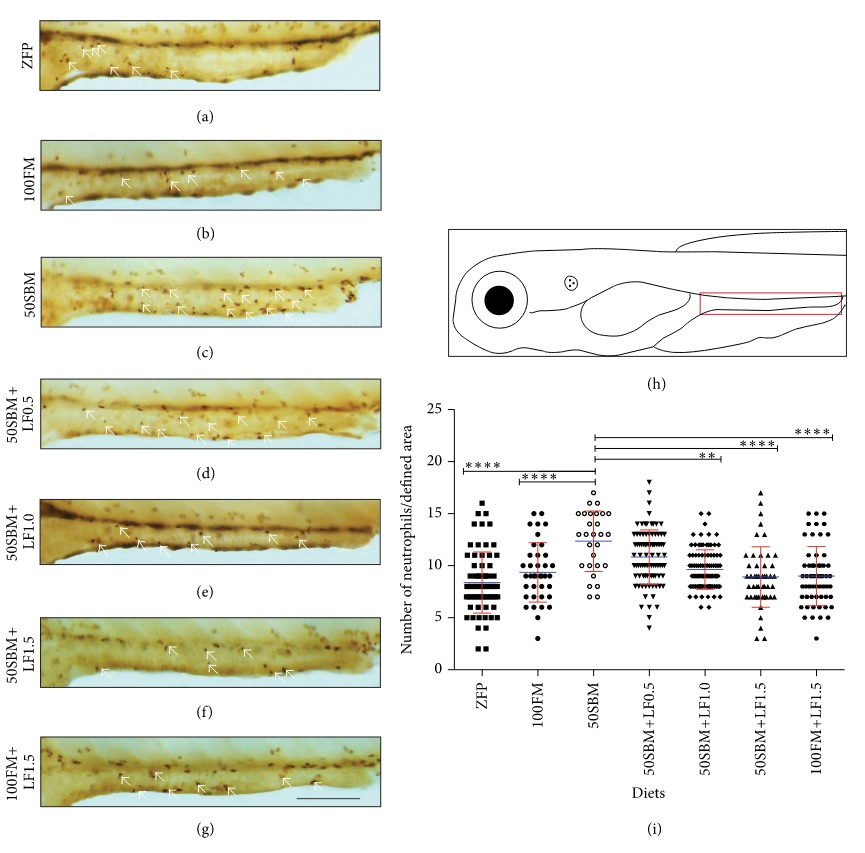
Fig. 1
Effect of different lactoferrin doses on neutrophil migration to the intestine. (a-g) Lateral view of mid and posterior intestine of Tg(BACmpo:GFPi114 larvae of 9 dpf after four days of feeding with different diets (ZFP, 100FM, 50SBM, 50SBM+LF0.5, 50SBM+LF1.0, 50SBM+LF1.5, and 100FM+LF1.5). Neutrophils were quantified through immunohistochemistry against GFP (white arrows). (h) Larva scheme with the intestinal region of interest demarcated with a red rectangle. (i) The experiments were conducted with at least 28 larvae per treatment in three different assays. Statistical analysis was performed by comparing data sets with the 50SBM diet through one-way ANOVA. The graph is a representation of three different results. **P < 0.01; ***P < 0.0001. Bar scale = 200 µm.