
- Title
-
Extraocular motoneuron pools develop along a dorsoventral axis in zebrafish, Danio rerio
- Authors
- Greaney, M.R., Privorotskiy, A.E., D'Elia, K.P., Schoppik, D.
- Source
- Full text @ J. Comp. Neurol.
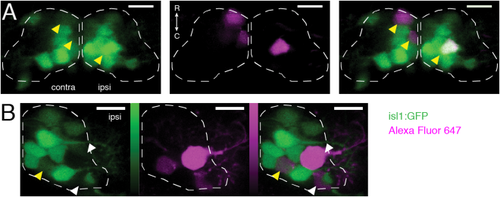
Identification of dye-filled motoneuron subtypes by projection pattern and Tg(isl1:GFP) expression. (A) Filled motoneurons in ventral nIII (plane z4, or 5th of 15 6-μm-thick planes counting dorsally from z0, dashed line). Yellow arrowheads indicate dye-filled motoneurons that were also GFP+ (contralateral: SR motoneurons; ipsilateral: IR/MR motoneurons). (B) Filled motoneurons in ventral nIII (plane z5, dashed line). White arrowheads indicate dye-filled motoneurons without GFP (IO motoneurons); yellow arrowhead indicates a dye-filled motoneuron that was also GFP+ (IR/MR motoneuron). Color bars represent photons detected in photon-counting mode (IO data only); green range: 0–198; magenta range: 0–231. Green = GFP; magenta = Alexa Fluor 647 dye. Scale bars = 10 μm. |
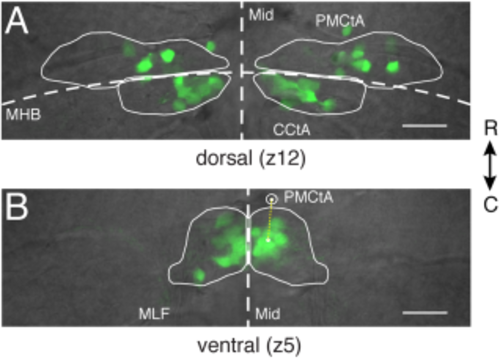
Fluorescent somata in Tg(isl1:GFP) zebrafish define the spatial extent of extraocular motoneurons in nIII and nIV. (A) Positions of fluorescent motoneurons in dorsal nIII/nIV (z12) relative to anatomical landmarks. nIII: rostral to MHB; nIV: caudal to MHB. (B) Positions of fluorescent motoneurons in ventral nIII (z5) relative to anatomical landmarks. Yellow dotted line represents the distance between the center of intensity of green fluorescence right of the midline and the centroid of the right PMCtA. Mid: midline. MHB: midbrain–hindbrain boundary. MLF: medial longitudinal fasciculus. PMCtA: posterior mesencephalic central artery. CCtA: cerebellar central artery. Scale bars = 20 μm. |
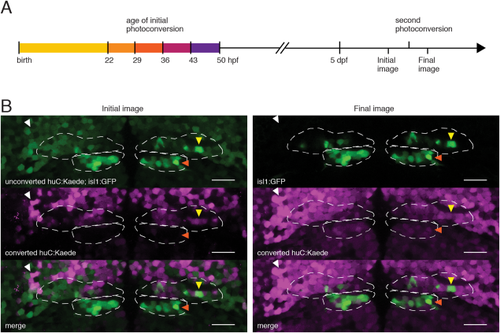
Birthdating Analysis by photoconverted fluorescent Protein Tracing In vivo, with Subpopulation Markers (BAPTISM) method (Caron et al., 2008) for identifying the time of terminal differentiation (birthdate) of motoneurons in Tg(huC:Kaede; isl1:GFP) zebrafish, which express photolabile fluorescent protein Kaede pan-neuronally. (A) Neurons born by the time of initial photoconversion (one of five timepoints shown) contain converted Kaede in initial image, taken at 5 dpf. Second photoconversion converts remaining Kaede, leaving GFP as the only green signal in Final image. Images are compared to determine birthdate of GFP+ motoneurons. (B) Dorsal plane (z12, dashed line) from a 5 dpf Tg(huC:Kaede; isl1:GFP) larva initially photoconverted at 36 hpf. Yellow arrowheads indicate an nIII motoneuron (isl:GFP+, final image) born by 36 hpf (converted huC:Kaede+, initial image). White arrowheads indicate a neuron born by 36 hpf not belonging to nIII/nIV. Orange arrowheads indicate an nIV motoneuron not born by 36 hpf. Scale bars = 20 μm. |