
- Title
-
Knockdown of ApoL1 in Zebrafish Larvae Affects the Glomerular Filtration Barrier and the Expression of Nephrin
- Authors
- Kotb, A.M., Simon, O., Blumenthal, A., Vogelgesang, S., Dombrowski, F., Amann, K., Zimmermann, U., Endlich, K., Endlich, N.
- Source
- Full text @ PLoS One

zApoL1 expression in different zebrafish organs. The expression of zApoL1 was determined in different organs like the kidney, skin, brain, heart, intestine, liver and pancreas if adult zebrafishs by RT-PCR in panel A and by immunohistochemistry in panel B. As a housekeeping gene, the elongation factor 1 (EF1) was used. Scale bars in panel B represent 500 μm (top) and 20 μm (bottom). |
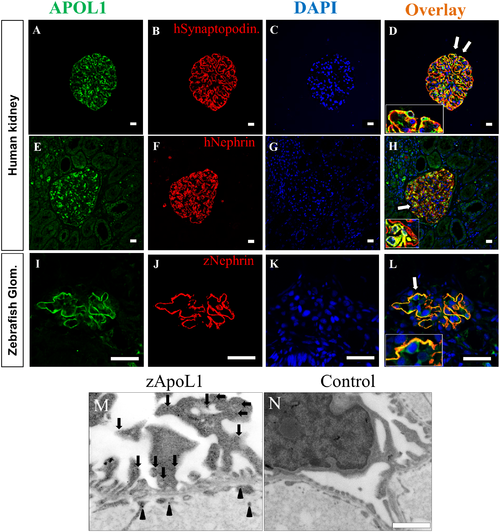
APOL1 expression in human and zebrafish glomeruli. The expression of APOL1 in podocytes is shown by double staining with an antibody against APOL1 and an antibody against the podocyte-specific proteins synaptopodin and nephrin (A-H). The regions in panel D and H labeled by arrows are shown in higher magnifications (insets). Similar to the human kidney, zApoL1 colocalizes with zNephrin in the zebrafish glomerulus (L). Panel M shows the localization of zApoL1 in podocytes (red circles) and in endothelial cells (green circles) by immunoelectron microscopy. Panel N shows the control reaction (secondary antibody only). Scale bars represent 20 μm (A-L) and 1 μm (M-N). EXPRESSION / LABELING:
|
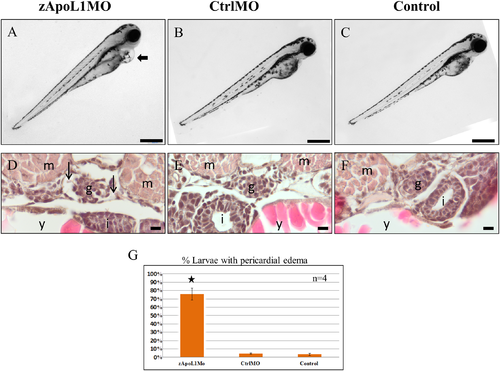
zApoL1 KD induces pericardial edema formation. Zebrafish larvae (4 dpf) developed edema (arrow in A) after the KD of zApoL1 in contrast to CtrlMO and untreated larvae (B, C). Paraffin tissue sections of the larvae showed enlarged Bowman’s space (arrows in D) due to the knockdown of zApoL1 compared to CtrlMO and untreated larvae (E, F). g—glomerulus, m—myotome, i—intestine, y—yolk sac. Panel G shows that more than 70% of the larvae developed edema in response to KD of zApoL1. Data are means±SD of 4 experiments on a total of 100 larvae. Scale bars represent 500 μm (A-C) and 10 μm (D-F). We have used t-test for statistical analysis. PHENOTYPE:
|
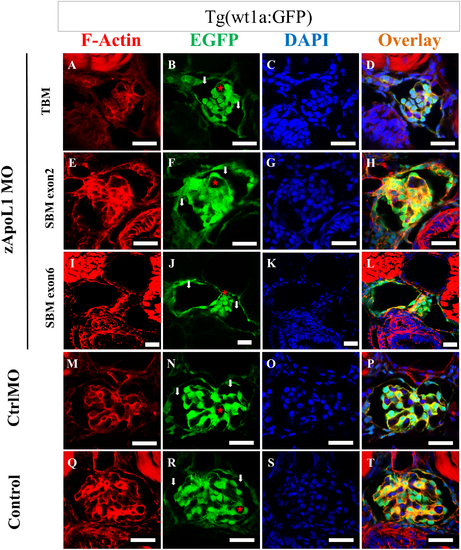
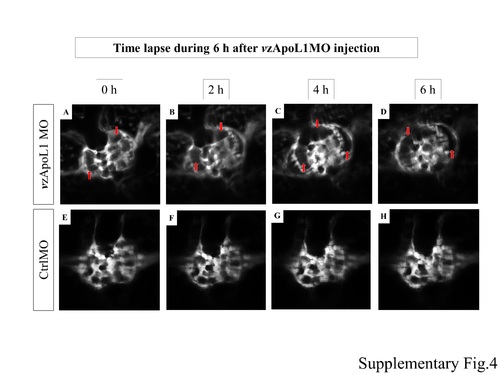
zApoL1 KD changes the morphology of the glomerulus. zApoL1 was knocked down in larvae expressing EGFP in podocytes by zApoL1 TBM (A-D), zApoL1 SBM exon2 (E-H) and zApoL1 SBM exon6 (I-L) morpholinos. Paraffin sections of the larvae were stained with Alexa 546-phalloidin for F-actin and DAPI for the nuclei. The KD with three different morpholinos against zApoL1 resulted in a similar phenotype, comprising dilation of Bowman’s space (arrows in B, F, J), collapse and malformation of the glomerular tuft (asterisks in B, F, J). CtrlMO and Control larvae are shown in panel M-T. Scale bars represent 20 μm. |
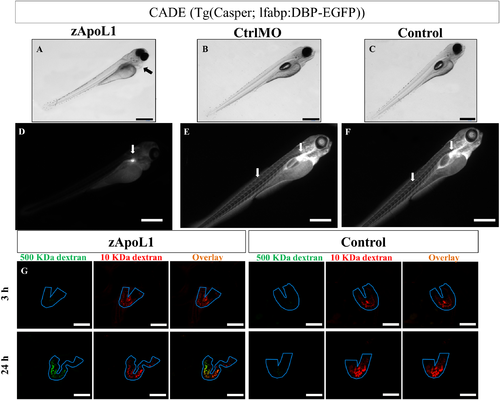
zApoL1 affects the glomerular filtration barrier of zebrafish larvae. After KD of zApoL1, larvae (CET strain) developed edema (arrow in A), a hallmark of a leaky glomerular filtration barrier. The loss of EGFP-vitamin D-binding protein from the blood resulted in a marked decrease of the fluorescence in the blood vessels (D). Only the fluorescence of the podocytes remained (arrow in D). In contrast the control larvae with an intact filtration barrier showed an intense staining of the vessels and the pronephric glomerulus (arrows in E, F). Alexa647-conjugated 10 kDa dextran and FITC-conjugated 500 kDa dextran were injected into the cardinal vene of the larvae (3 dpf). 3 and 24 h after injection, the fluorescence in the pronephric tubules (outlined in blue in G) was determined. Only zApoL1MO larvae showed a green fluorescence in the tubules at 24 h, indicating leakage of 500 kDa dextran through the glomerular filtration barrier. The control larvae showed only the red fluorescence of the filtered 10 kDa dextran. Scale bars represent 500 μm (A-F) and 50 μm (G). |
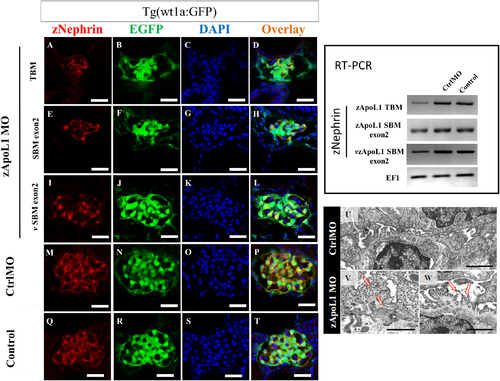
zApoL1 KD reduces the expression of nephrin. The expression of nephrin was significantly reduced in podocytes (green) after zApoL1 KD: zApoL1 TBM (A-D), zApoL1 SBM exon2 (E-H) and vivo-zApoL1 SBM exon2 (I-L) in contrast to CtrlMO (M-P) and untreated larvae (Q-T). RT-PCR shows a marked decrease of nephrin mRNA expression after zApoL1 knockdown compared to CtrlMO and control larvae. The elongation factor 1 (EF1) was used as a housekeeping gene. The right panel shows one representative experiment out of three. Scale bars represent 20 μm. (U) CtrlMO larvae have nicely developed foot processes in contrast to zApoL1 larvae that showed effacement of foot processes at some areas (V). Furthermore, the foot processes of zApoL1 KD larvae are sometimes surrounded by GBM (arrow in V) and developed microvilli-like structures protruding in the urinary space, respectively. Scale bar represents 1 μm. |
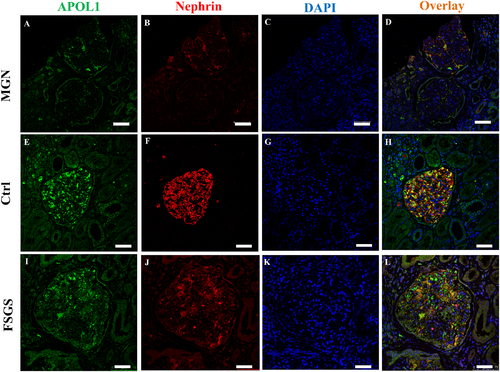
APOL1 and nephrin expression in kidney biopsies. Tissue sections of biopsies of patients suffering from membranous glomerulonephritis (MGN) and focal segmental glomerulosclerosis (FSGS) stained with antibodies against APOL1 and nephrin showed a marked decrease of APOL1 (A, I) as well as nephrin (B, J) in podocytes. Scale bars represent 20 μm. |
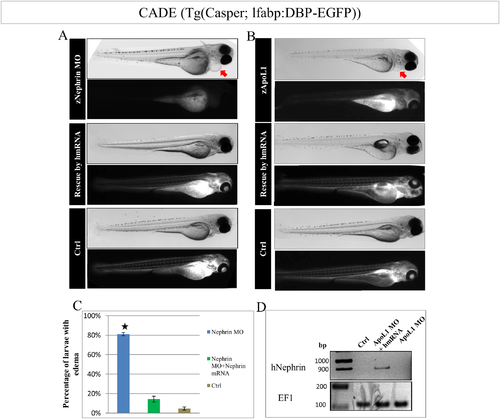
zApoL1 KD rescue in zebrafish larvae by human Nephrin mRNA. The rescue of the nephrin KD by human Nephrin mRNA (hmRNA) resulted in zebrafish larvae (CADE) without edema and with an intact filtration barrier (A). The KD of zApoL1 was rescued by co-injection of hmRNA resulting in zebrafish larvae without any phenotype (B). C shows the percentage of larvae with an edema after nephrin KD and rescue by hmRNA. The expression of the human mRNA was verified by RT-PCR as shown in D. We have used t-test for statistical analysis. |
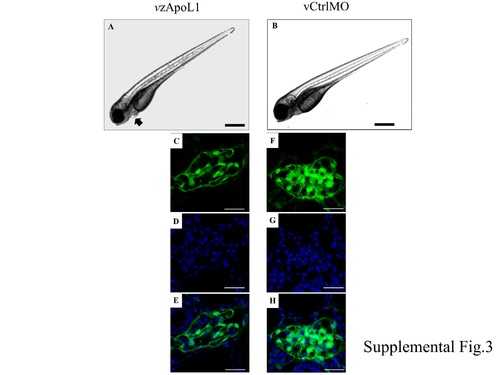
zApoL1 by in vivo morpholinos. |
in vivo observation. |