
|
Fig. 6
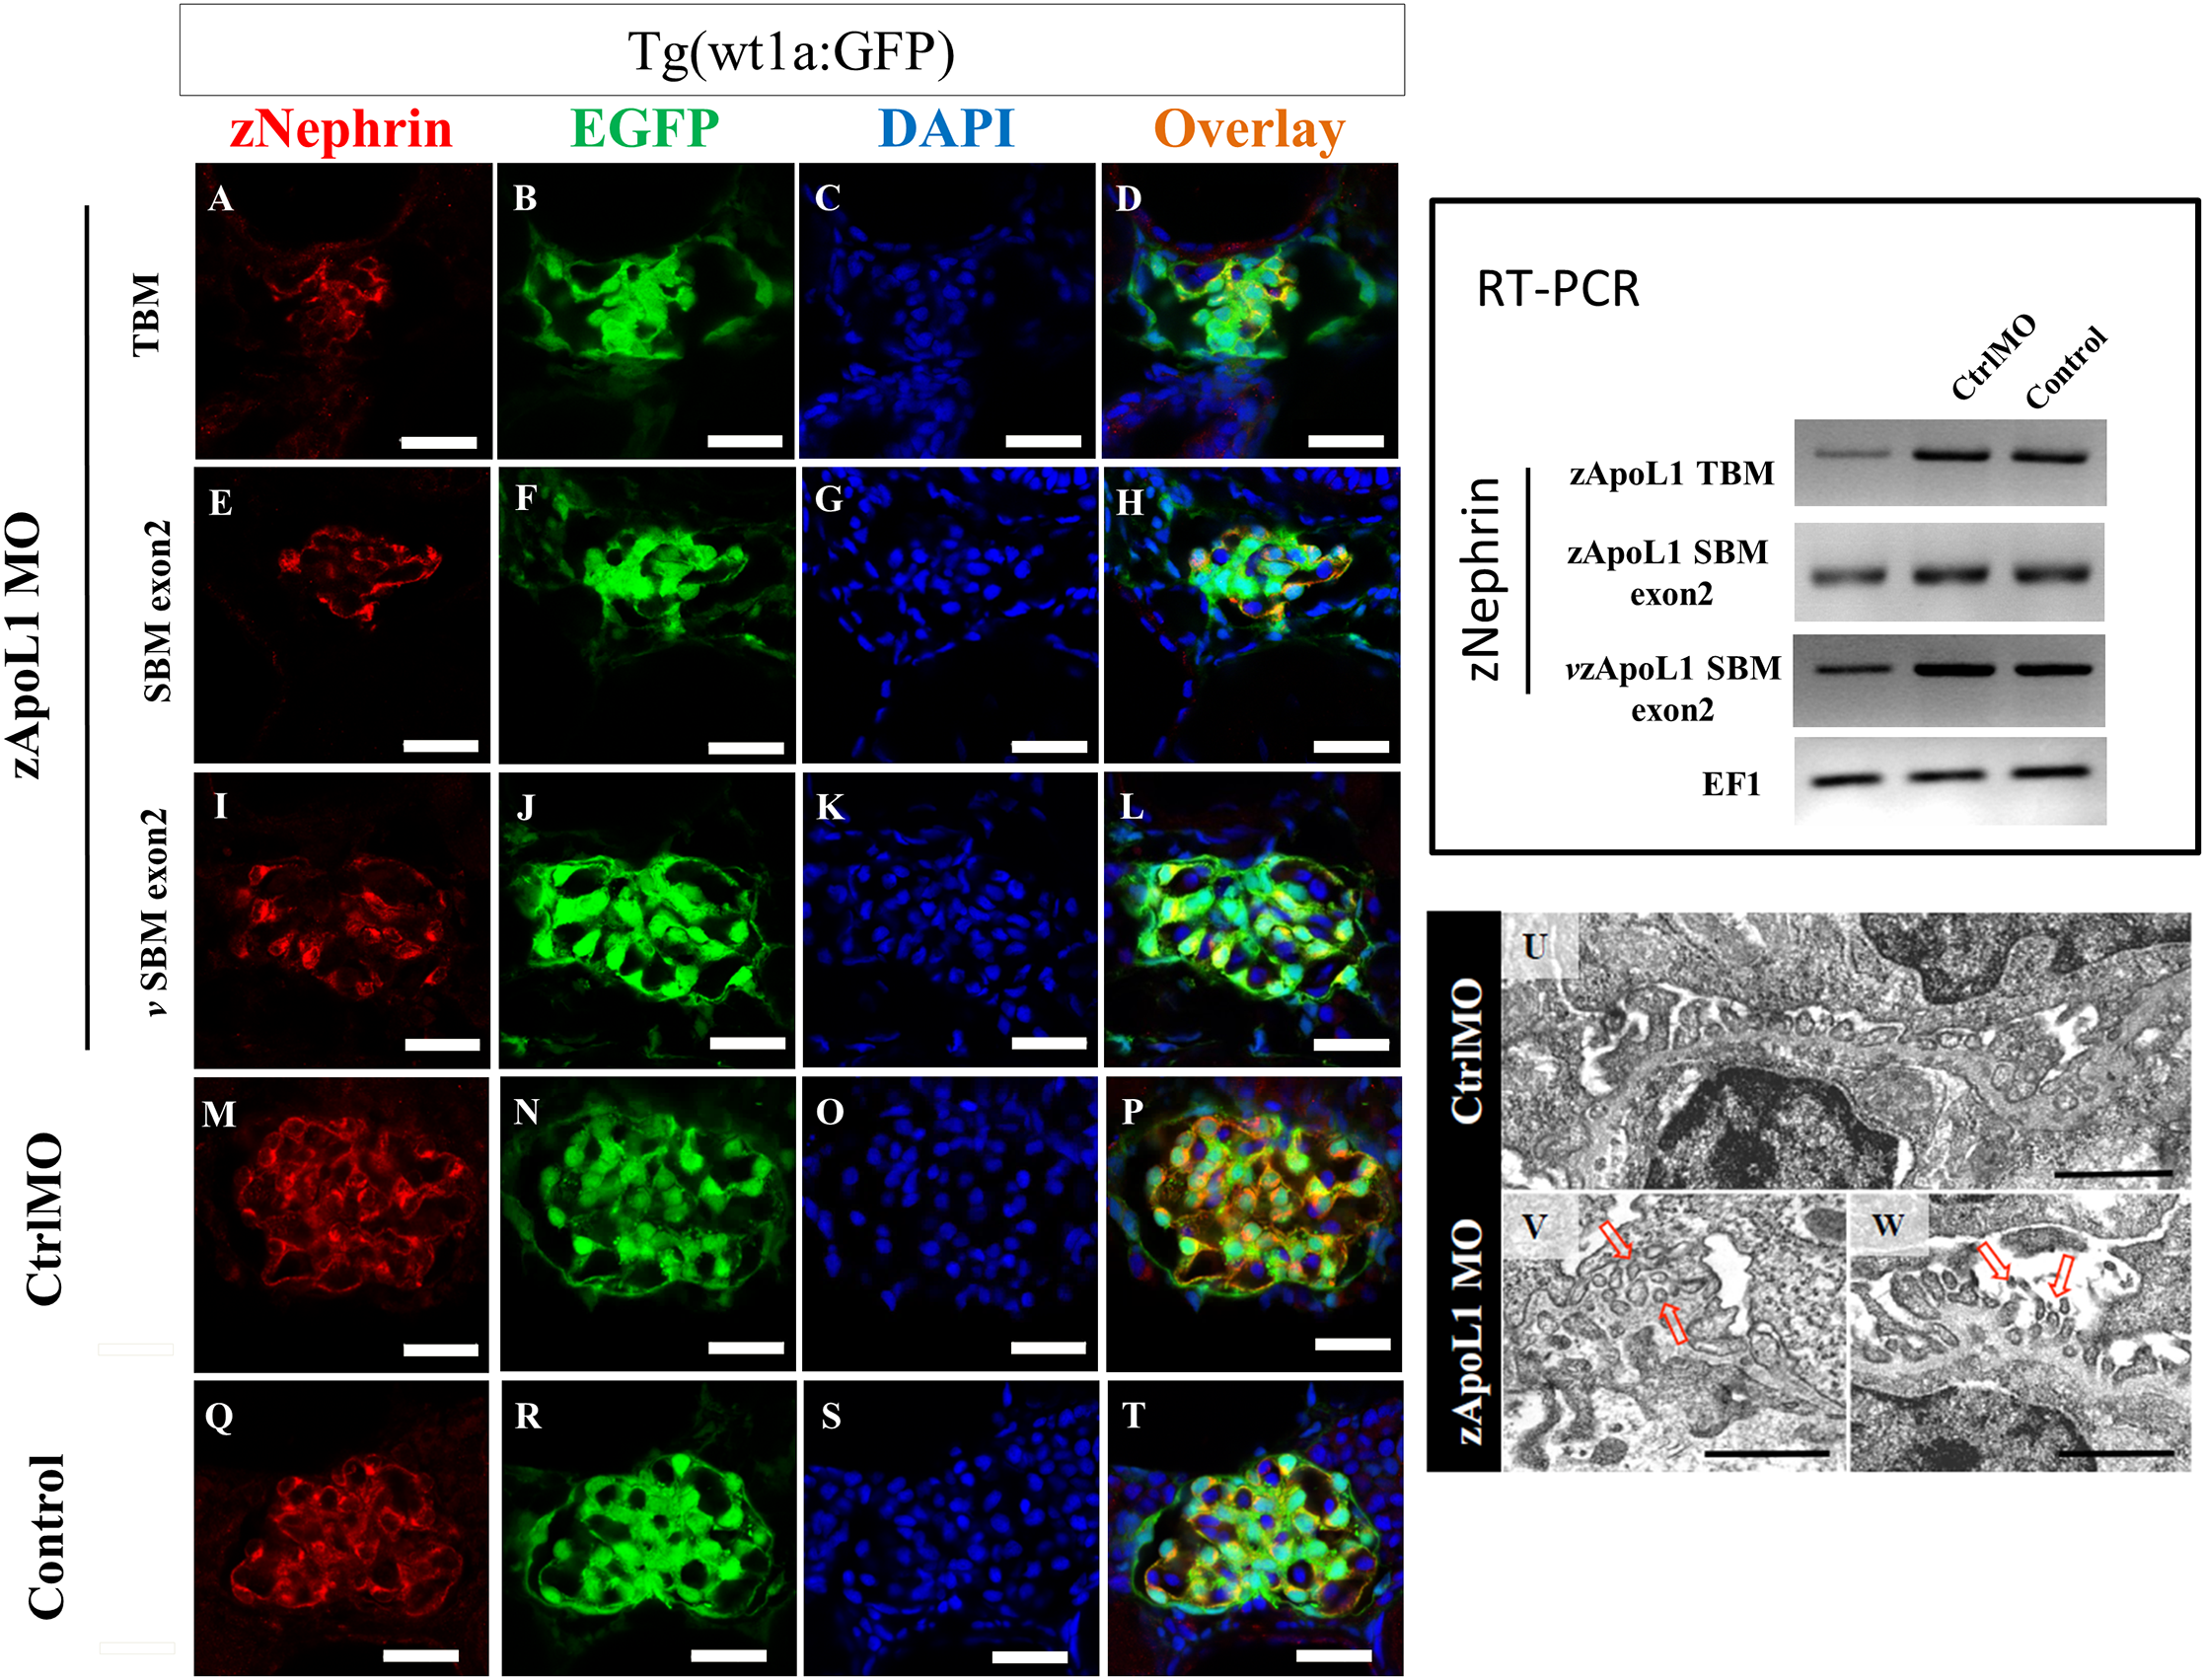
zApoL1 KD reduces the expression of nephrin.
The expression of nephrin was significantly reduced in podocytes (green) after zApoL1 KD: zApoL1 TBM (A-D), zApoL1 SBM exon2 (E-H) and vivo-zApoL1 SBM exon2 (I-L) in contrast to CtrlMO (M-P) and untreated larvae (Q-T). RT-PCR shows a marked decrease of nephrin mRNA expression after zApoL1 knockdown compared to CtrlMO and control larvae. The elongation factor 1 (EF1) was used as a housekeeping gene. The right panel shows one representative experiment out of three. Scale bars represent 20 μm. (U) CtrlMO larvae have nicely developed foot processes in contrast to zApoL1 larvae that showed effacement of foot processes at some areas (V). Furthermore, the foot processes of zApoL1 KD larvae are sometimes surrounded by GBM (arrow in V) and developed microvilli-like structures protruding in the urinary space, respectively. Scale bar represents 1 μm.