
- Title
-
Using mouse and zebrafish models to understand the etiology of developmental defects in Cornelia de Lange Syndrome
- Authors
- Kawauchi, S., Santos, R., Muto, A., Lopez-Burks, M.E., Schilling, T.F., Lander, A.D., Calof, A.L.
- Source
- Full text @ Am J Med Genet C Semin Med Genet
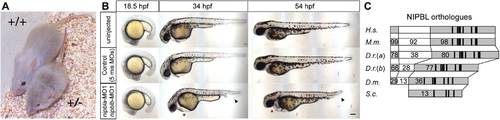
Nipbl-deficient mutant animals show growth abnormalities. (A) Nipbl+/- mouse is markedly smaller than wildtype (+/+) sibling at 4 weeks of age. (B) Nipbl a+b morpholino (MO) co-injected zebrafish larvae (nipbl a/b morphants) resemble uninjected and mixed MO controls at 18.5 hr post-fertilization (hpf), but show marked circulatory defects, pericardial edema (asterisk) and tail defects (arrowheads) by 34 hpf. Scale bar = 100 µm. (C) Structural comparison of NIPBL orthologues among different species. H.s., Homo sapiens, 2,804 amino acids (aa).; M.m., Mus musculus, 2,798 aa; D.r. (a), Danio rerio, form a, 2,876 aa; D.r. (b), form b, 2,381 aa; D.m., Drosophila melanogaster, 2,077 aa; S.c., Saccharomyces cerevisiae, 1,493 aa. Numbers indicate percent amino acid sequence identity compared to human NIPBL. Adapted from [Kawauchi et al., 2009; Muto et al., 2011]. |
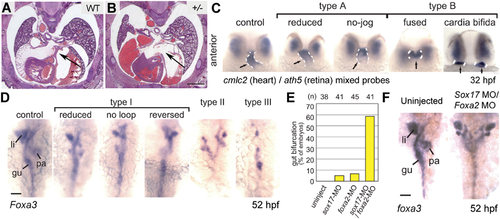
Heart and gut abnormalities in Nipbl-deficient animals. (A and B) Cryosections, stained with hematoxylin/eosin, of wildtype and Nipbl+/- littermate embryos at gestational day 17.5 (E17.5). A well-formed atrial septum is apparent in the wildtype heart, but absent in a significant fraction of mutants. Scale bar = 1 mm. (C) Zebrafish embryos injected with nipbla/b MOs show a range of defects in heart tube formation at 32 hpf, ranging from mild (type A) to severe (type B). Dashed white lines indicate heart tube, labeled by in situ hybridization (ISH) for a cmlc2 probe (ath5 ISH shows that eye is relatively unaffected). (D) Gut and visceral organ morphology assessed by ISH for foxa3 in nipbla/b morphants at 52 hpf. Defects ranged from mild looping defects (type I) to more severe defects such as bifurcation (type II) and even absence (type III) of gut parenchyma. gu, gut tube; li, liver; pa, pancreas. (E) Frequency of gut bifurcation in sox17 and foxa2 single and double morphants at 52hpf. (F) Example of severe gut bifurcation in sox17/foxa2 double morphant embryo. Scale bar in D and F = 50 µm. Adapted from [Kawauchi et al., 2009; Muto et al., 2011]. |
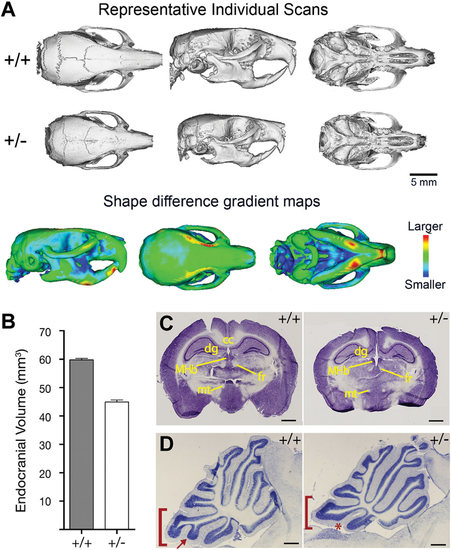
Craniofacial and neuroanatomical abnormalities in Nipbl+/- mice. (A) Top two panels show representative reconstructions of individual scans based on micro-CT analysis of wildtype (top panel) and Nipbl+/- (middle panel) adult mice. Dorsal, lateral, and ventral views are shown. Bottom panel shows shape distance heat maps of wildtype overlaid with mutant skulls, from the entire dataset. The degree of shape change in specific bones is shown by different colors, as indicated in the heat map at right. (B) Endocranial volume (measured from CT scans) is reduced by 25% in in Nipbl+/- mice compared to wildtype. (C) Nissl-stained coronal sections of wildtype (+/+) and Nipbl-deficient (+/-) adult brains. MHb, medial habenular nucleus; fr, fasiculus retroflexus; mt, mammillothalamic tract; dg, dentate gyrus; cc, corpus callosum. Scale bar =1 mm. (D) Cerebellar vermal hypoplasia in Nipbl+/- mice. Folium IX (bracket) and its ventral subfolium (arrow, asterisk) are affected. Scale bar = 500 µm. Adapted from [Kawauchi et al., 2009]. |
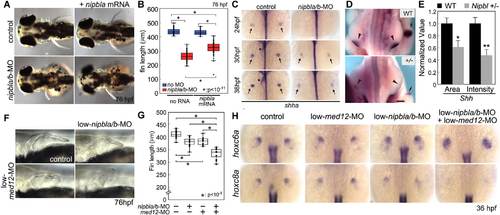
Limb defects and gene expression changes in Nipbl-deficient zebrafish and mice. (A) Defects in pectoral fin development are observed in nipbla/b morphants; defects are partially rescued by injection of exogenous nipbla mRNA. Dorsal view of zebrafish larvae at 76 hpf. (B) Plots of fin lengths in morphants and controls at 76 hpf. (C) Expression of shha (ISH) in pectoral limb buds (arrows) is reduced in nipbla/b morphants at three indicated stages of development. (D) Whole-mount ISH for Shh in E10.5 mouse embryos; expression is reduced in Nipbl+/- hindlimb buds compared to wildtype (WT). Arrowheads indicate hindlimbs; arrows indicate forelimbs. Scale bar = 0.5 mm. (E) Quantification of Shh ISH shown in D; *P < 0.05, **P < 0.01. (F) Zebrafish larvae injected with low doses of med12 or nipbla/b MOs display small reductions in fin size compared to controls; defects are enhanced when morphants are treated with combined nipbla/b and med12 MOs. (G) Plots of fin lengths in morphants and controls in the four conditions. (H) Changes in hox gene expression in morphants treated with nipbla/b, med12, and nipbla/b + med12 MOs at 36 hpf. Adapted from [Muto et al., 2014]. |
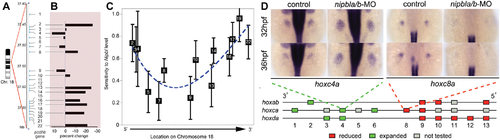
Position-specific effects of Nipbl on gene expression. (A) Schematic of protocadherin beta (Pcdhb) locus (consisting of 22 genes) on chromosome 18 in mouse. (B) Quantitative RT-PCR results showing changes in gene expression in 14 of the 22 Pcdhb genes in E17.5 Nipbl+/- brain compared to wildtype controls. (C) Representative graph showing sensitivity of Pcdhb gene expression levels to Nipbl levels in the same samples. Sensitivities and error bars were plotted on an abscissa corresponding to the location of the transcriptional start sites of each of the Pcdhb genes. The dashed line is a smooth polynomial fit to the data. Data indicate that sensitivity of Pcdhb gene expression to Nipbl levels is highest at the 5′ and 3′ ends of the cluster, lowest in the middle. (D) ISH demonstrating mis-expression of hox genes in nipbla/b morphant zebrafish embryos (over-expression: hoxc4a; under-expression: hoxc8a). Schematic diagram represents effects of reduced nipbl levels on hox gene expression, with 5′ hox genes showing reductions in expression (red) and 3′ hox genes showing expanded expression (green). Adapted from [Kawauchi et al., 2009; Muto et al., 2011]. |