
|
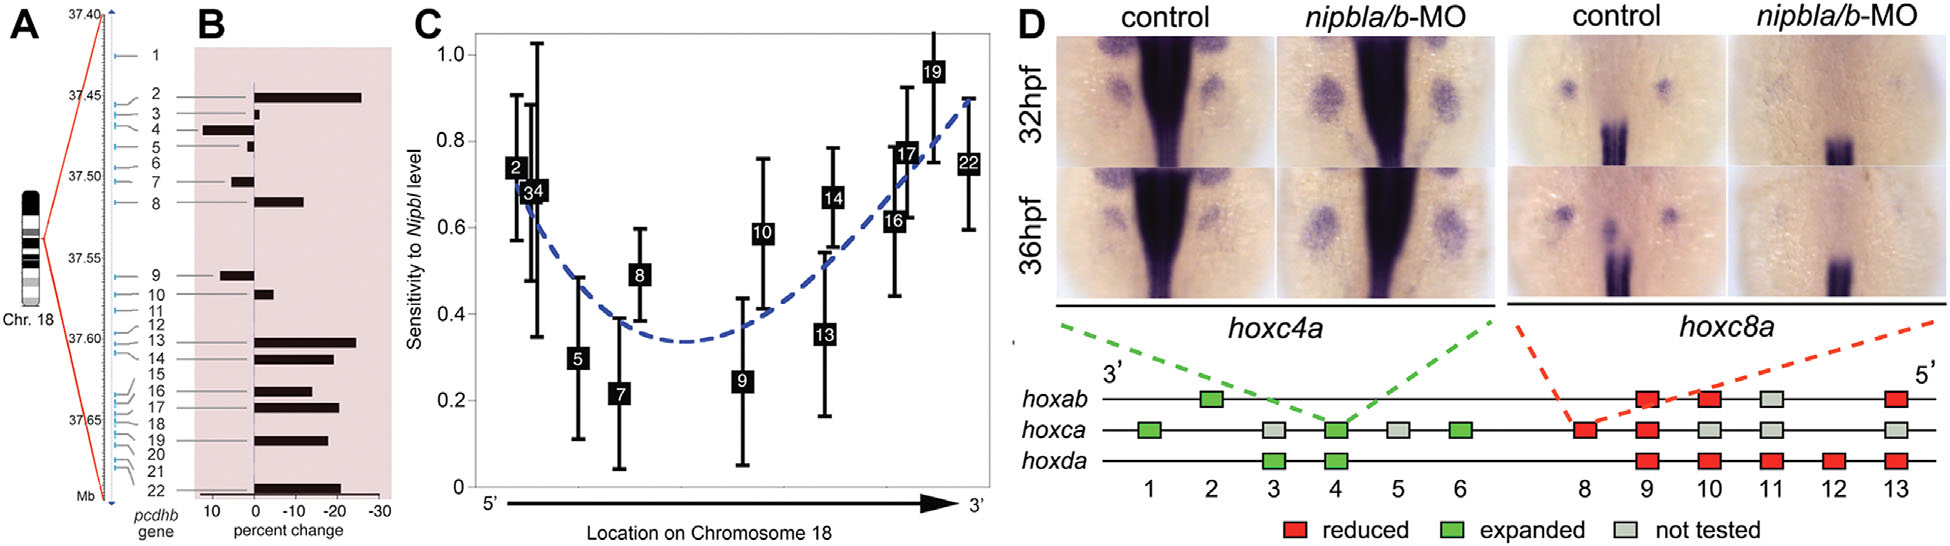
Fig. 5
Position-specific effects of Nipbl on gene expression. (A) Schematic of protocadherin beta (Pcdhb) locus (consisting of 22 genes) on chromosome 18 in mouse. (B) Quantitative RT-PCR results showing changes in gene expression in 14 of the 22 Pcdhb genes in E17.5 Nipbl+/- brain compared to wildtype controls. (C) Representative graph showing sensitivity of Pcdhb gene expression levels to Nipbl levels in the same samples. Sensitivities and error bars were plotted on an abscissa corresponding to the location of the transcriptional start sites of each of the Pcdhb genes. The dashed line is a smooth polynomial fit to the data. Data indicate that sensitivity of Pcdhb gene expression to Nipbl levels is highest at the 5′ and 3′ ends of the cluster, lowest in the middle. (D) ISH demonstrating mis-expression of hox genes in nipbla/b morphant zebrafish embryos (over-expression: hoxc4a; under-expression: hoxc8a). Schematic diagram represents effects of reduced nipbl levels on hox gene expression, with 5′ hox genes showing reductions in expression (red) and 3′ hox genes showing expanded expression (green). Adapted from [Kawauchi et al., 2009; Muto et al., 2011].