
- Title
-
A Sawtooth Pattern of Cadherin 2 Stability Mechanically Regulates Somite Morphogenesis
- Authors
- McMillen, P., Chatti, V., Jülich, D., Holley, S.A.
- Source
- Full text @ Curr. Biol.
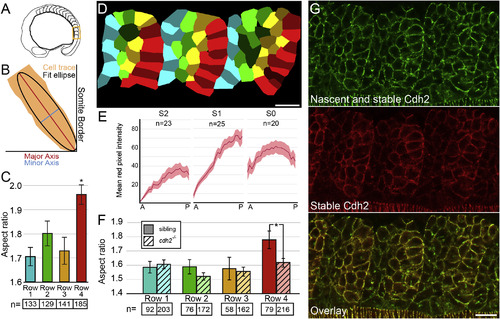
Cell-Shape Changes Correlate with Graded Stable Cdh2 Adhesions along Posterior Somite Border Cells (A) A schematic of the region of the embryo containing the most recently formed somites imaged in (D) and (G). (B) The aspect ratio of cell traces was determined by dividing the major axis length by the minor axis length of a fit ellipse. (C and D) Posterior somite boundary cells (row 4, red) exhibit an increased aspect ratio compared with row 1 cells (p < 0.00001, t test). (E and G) Somites exhibit graded levels of stable Cdh2 (red) adhesion increasing from anterior to posterior. (F) The aspect ratio of posterior somite boundary cells is reduced in cdh2-/- embryos (p < 0.01, t test). n, number of cells for (C) and (F); n, number of somites for (E). Mean values indicated ± SEM. Scale bars, 20 µm. See also Figure S1. |
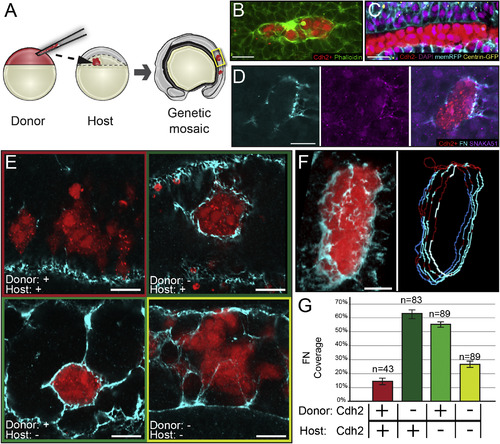
Differential cdh2 Expression Stimulates Tissue Boundary Formation (A) Genetic mosaics were generated by transplanting blastomeres from early blastula-stage donors labeled with fluorescent dextran (rhodamine or Alexa Fluor 647) into later blastula-stage hosts. (B) Clones were analyzed for F-actin localization via phalloidin staining. 17 of 27 clones exhibited strong cortical actin. (C) Cdh2-expressing cells polarize toward boundaries with Cdh2-deficient cells. Ten of 12 clones exhibit columnar cell shape, basal nuclei, and apical centrosomes. (D) Clones were analyzed for Itgα5 activation using the SNAKA51 antibody and FN matrix assembly. Nine of nine clones displayed activated Itgα5 and FN matrix. (E) Robust FN matrix forms at boundaries between Cdh2-expressing and Cdh2-deficient cells. (F and G) The percentage of FN coverage of the rhodamine-labeled clones was quantified in multiple z-slices using an ImageJ macro (see Supplemental Experimental Procedures). Pixels positive for FN are blue; pixels negative for FN are red. n, the number of clones examined. Scale bars, 20 µm. See also Figure S2. |
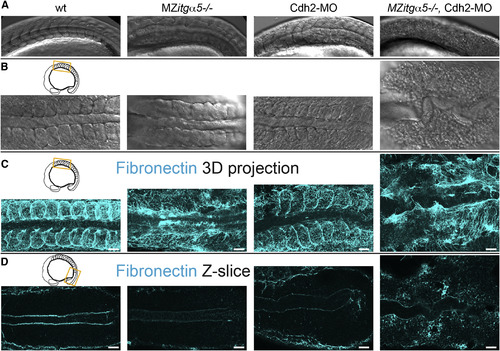
Coordinated Regulation of ECM Assembly by Cdh2 and Itgα5 (A and B) Lateral (A) and dorsal (B) views of the anterior paraxial mesoderm in 10- to 12-somite-stage embryos showing loss of somite borders and de-adhesion of cells in MZitgα5-/-;cdh2mo embryos (n = 8). (C) 3D dorsal projection of anterior paraxial mesoderm FN immunolocalization z stacks showing loss of dorsolateral FN in MZitgα5-/-;cdh2mo embryos. (D) Single dorsal z-slices of FN immunolocalization of posterior paraxial mesoderm showing globular FN in cdh2mo embryos and diffuse ectopic FN in MZitgα5-/-;cdh2mo embryos. Scale bars, 40 µm. |
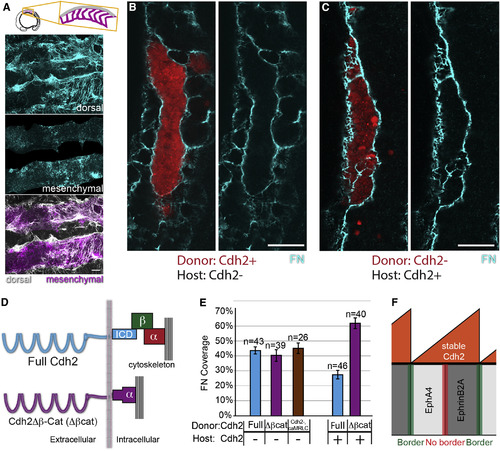
Cdh2 Bimodally Regulates ECM Assembly through Distinct Molecular Mechanisms (A) MZitgα5-/-;cdh2mo embryos exhibit decreased dorsal ECM assembly and increased ectopic mesenchymal ECM. (B and C) In mosaic embryos, mesenchymal ECM forms in either Cdh2– hosts (B) or donor clones (C), but not among Cdh2+ neighboring cells. (D) Schematic of the Cdh2Δβ-Cat (Δβcat) construct in which Cdh2 is fused directly to α-catenin, thus mediating adhesion without binding β-catenin. (E) Δβcat stimulates FN matrix assembly to the same extent as full-length Cdh2 (p > 0.25) but does not inhibit FN matrix assembly (p < 0.0001). caMRLC also stimulates FN matrix assembly (p < 0.0001) to the same extent as full-length Cdh2 and Cdh2Δβ-Cat (p > 0. 25). n, number of clones examined. Mean values indicated ± SEM. Scale bars, 20 µm. p values were determined by t test. (F) A model schematic showing graded stable Cdh2 levels inhibiting boundary formation at Eph/ephrin interfaces within somites while differential levels of stable Cdh2 promote boundary formation at Eph/ephrin interfaces between somites. See also Figure S3. |
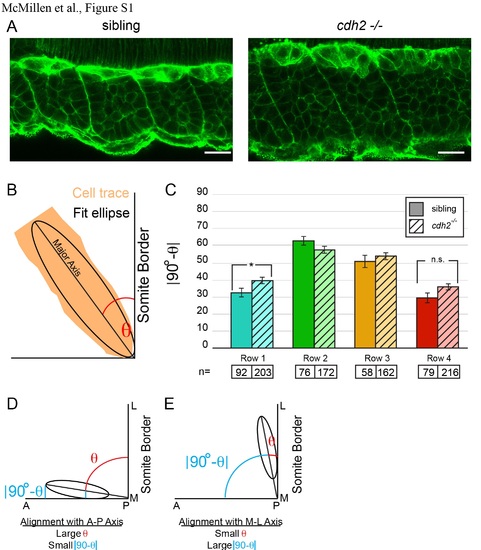
Polarized orientation of posterior somite cells is not affected in cdh2-/- embryos; related to Figure 1. (A) Phalloidin was used to outline cell cortices in cdh2-/- embryos and wild-type siblings. (B) The polarized orientation of cells with respect to the somite boundary was determined by measuring the angle θ between fit ellipses of cell traces and the somite border. The alignment was then calculated using the absolute value of 90-θ, which is small when the cell is aligned along the Anterior-Posterior axis (i.e. perpendicular to the somite border) (D) and large when the cell is aligned with the Medial-Lateral axis (i.e. parallel to the somite border) (E). Though the aspect ratio is reduced in row 4 cells in cdh2-/- (Figure 1E), the polarized orientation in these cells is not affected by loss of cdh2 (p>0.05). A modest change in polarized orientation is seen in row 1 cells (p<0.05). Scale bar = 20 µm. |
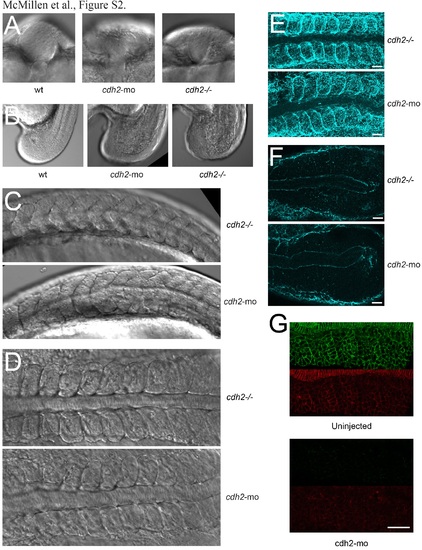
Thecdh2mophenotype recapitulates the cdh2-/- phenotype; related to Figure 2. (A) Both mutant and morphant phenotypes include abnormal neural tube morphogenesis and (B) cell de-adhesion within the tailbud. Neither manipulation affects somite boundary formation as visualized by either DIC (C,D) or FN immunolocalization (E). Furthermore, both phenotypes exhibit FN formation within the mesenchymal presomitic mesoderm (F). (G) Thecdh2moalso strongly inhibits both total and stable Cdh2 as reported by the cdh2-sfGFPTagRFP transgene (n=9). Scale bar = 40 µm. |
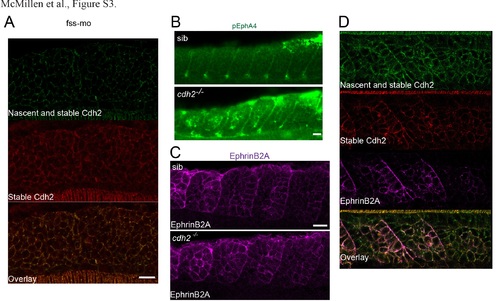
Sawtooth Cdh2 stabilization is downstream of patterning by the segmentation clock and regulates EphA4 phosphorylation; related to Figure 4. (A) Injection of 200 µM fssmo [S1] inhibits the formation of sawtooth gradients of Cdh2 stability in cdh2-sfGFPTagRFP transgenic embryos (n=11). (B) Loss of cdh2 does not affect activation/phosphorylation of EphA4 at somite boundaries, but does increase EphA4 activation within the mesenchymal core of somites. An average of 55.4% of somites in cdh2-/- embryos exhibited mesenchymal EphA4 phosphorylation (n=25 embryos) vs. 26.9% in (n=28) sibling control embryos (p<0.001, Mann-Whitney-Wilcoxon test). (C) The segmental pattern of EphrinB2A remains in cdh2-/- embryos (n=9). (D) EphrinB2A colocalizes with stable Cdh2 in the posterior somite (n=29). Scale bar = 20 µm. |