
|
Fig. 1
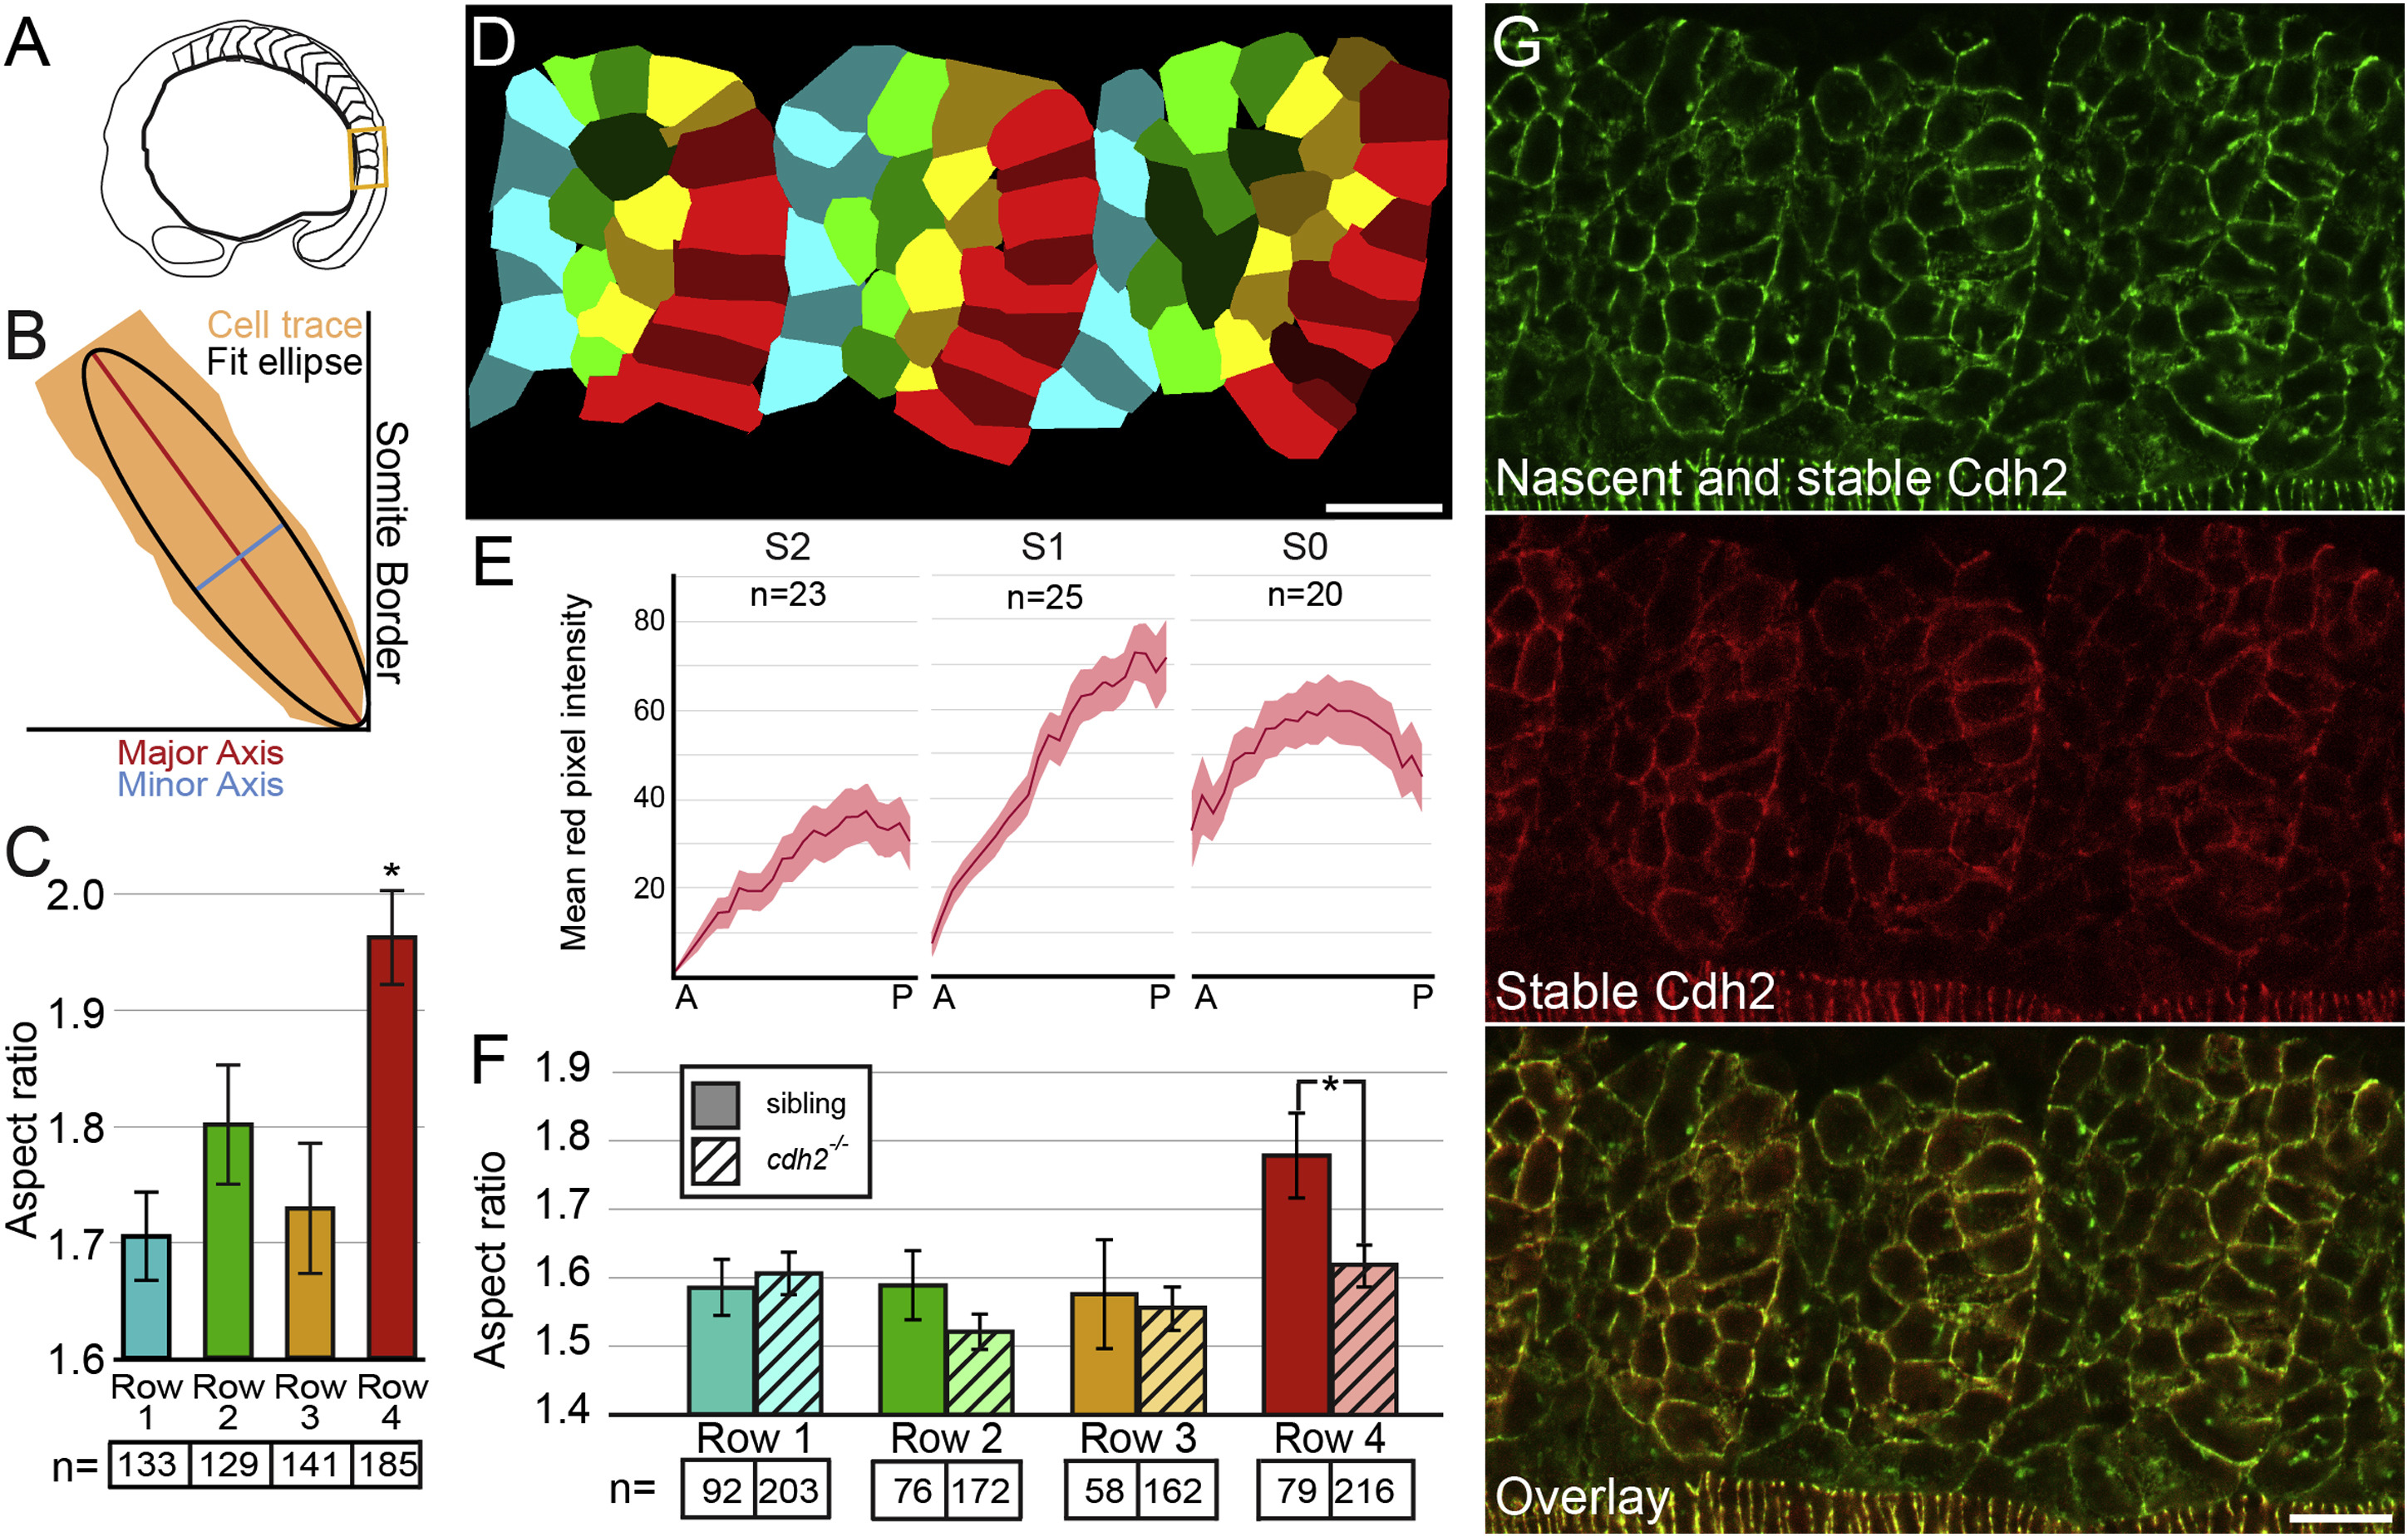
Cell-Shape Changes Correlate with Graded Stable Cdh2 Adhesions along Posterior Somite Border Cells
(A) A schematic of the region of the embryo containing the most recently formed somites imaged in (D) and (G).
(B) The aspect ratio of cell traces was determined by dividing the major axis length by the minor axis length of a fit ellipse.
(C and D) Posterior somite boundary cells (row 4, red) exhibit an increased aspect ratio compared with row 1 cells (p < 0.00001, t test).
(E and G) Somites exhibit graded levels of stable Cdh2 (red) adhesion increasing from anterior to posterior.
(F) The aspect ratio of posterior somite boundary cells is reduced in cdh2-/- embryos (p < 0.01, t test).
n, number of cells for (C) and (F); n, number of somites for (E). Mean values indicated ± SEM. Scale bars, 20 µm. See also Figure S1.