
- Title
-
Stable multilineage xenogeneic replacement of definitive hematopoiesis in adult zebrafish
- Authors
- Hess, I., Boehm, T.
- Source
- Full text @ Sci. Rep.
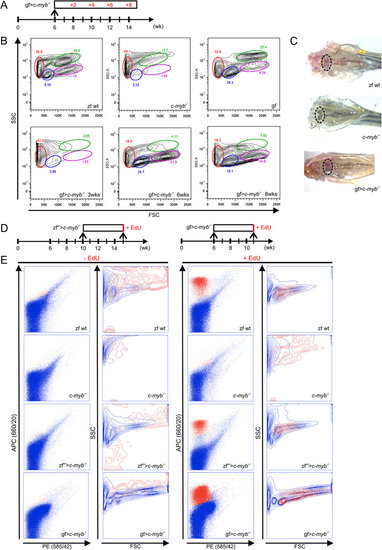
Reconstitution of hematopoiesis in adult c-mybI181N zebrafish mutants after transplantation of goldfish kidney marrow cells.(A) Schematic outline. A total of 23 transplantations were carried out and analyzed at various time points; representative data are shown for each time point. (B) Flow cytometric analysis of whole kidney marrow cell populations of adult fish of various genotypes and species (top panels) and after transplantation of goldfish marrow cells into mutant zebrafish (lower panels); the time points indicate time periods after transplantation. Wild type zebrafish (zf wt), c-myb mutant (c-myb-/-), goldfish (gf) and c-myb mutant transplanted with goldfish whole kidney marrow cells (gf > c-myb-/-). The different cell populations in zebrafish kidney are identified by their forward (size) and side (granularity) light scatter characteristics: red, erythrocytes; blue, lymphocytes; green, myelomonocytic cells; magenta, progenitor cells. (C) Macroscopic representation of kidney of wild type zebrafish (left), zebrafish mutants (middle), and zebrafish mutants reconstituted with goldfish hematopoietic cells (4 weeks after transplantation; right), all 10 weeks old. The locations of the head kidneys are indicated by ovals. (D) Schematic outline of proliferation assay. (E) Flow cytometric analysis of whole kidney marrow cells isolated from fish of the indicated genotypes pulse-labelled with EdU, creating a red-fluorescent signal in cells. No signal is observed in control mock-pulsed cells (two leftmost columns). Proliferating cells are detectable only in wild type zebrafish kidney marrow and in mutant zebrafish reconstituted with either zebrafish or goldfish cells, but not in unmanipulated zebrafish mutants (third column from the left). The light scatter characteristics of EdU-positive cells (red) are superimposed on EdU-negative cells (blue) (second and fourth columns from the left). Representative data of corresponding biological replicates are shown (zebrafish wild type, n = 7; c-myb-/-, n = 5; zf > c-myb-/-, n = 3; gf > c-myb-/-, n = 3). |
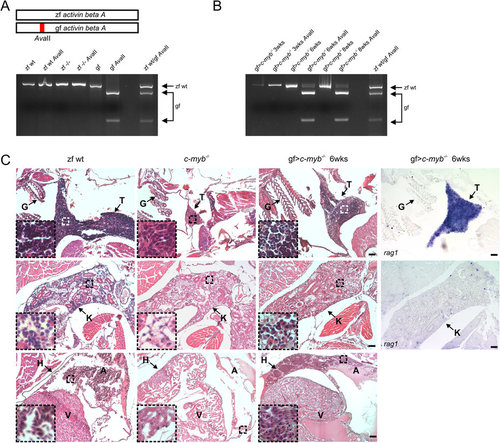
Multilineage hematopoietic reconstitution of c-myb mutant zebrafish after transplantation of goldfish whole kidney marrow cells.(A) Genotyping of whole kidney marrow cells of fish of indicated genotypes. The schematic at the top highlights the AvaII restriction site distinguishing zebrafish and goldfish sequences of the activin beta A gene (c.f. Supplementary Fig. 2A). Amplicons are shown before and after AvaII digestion of wild type zebrafish (zf wt), c-myb mutant zebrafish (zf-/-), and goldfish (gf). The AvaII digest of an amplicon generated from a 1+1 mixture of wild type zebrafish and goldfish cells is also shown on the right for reference. (B) Genotyping of whole kidney marrow cells of c-myb mutant zebrafish reconstituted with goldfish whole kidney marrow cells (gf > c-myb-/-) at several time points (in weeks) after transplantation. (C) Histological analysis of reconstituted c-myb mutant animals. Sections of the thymus (top panels), kidney (middle panels), and heart (bottom panels) are shown; insets represent 4× higher magnifications (haematoxylin/eosin staining) with the origin of selected regions indicated by broken squares (see also Supplementary Fig. 3). The fourth column indicates the results of RNA in situ hybridization using a rag1 probe, detecting lymphoid progenitor cells actively rearranging antigen receptor loci. Wild type zebrafish (zf wt), c-myb mutant (c-myb-/-), and c-myb mutant transplanted with goldfish whole kidney marrow cells 6 weeks after transplantation (gf > c-myb-/-). All fish are 12 weeks old. Anatomical landmarks are indicated (G, gills; T, thymus; K, kidney; H, heart; A, atrium of the heart; V, ventricle of the heart). Scale bars, 50 µm. |
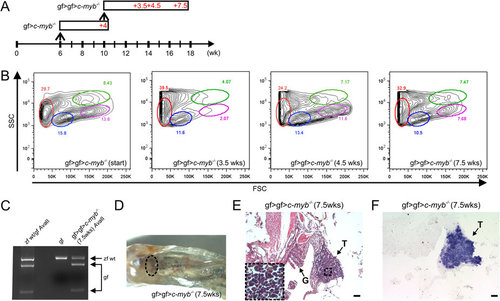
Serial transplantation of goldfish hematopoietic progenitors.(A) Schematic of successive transplantation experiment. A total of 8 transplantations were carried out and analyzed at various time points; representative data are shown for each time point. The first transplantation (gf > c-myb-/-) was carried out when c-myb mutants had reached the age of 6 weeks; the secondary transplantation (gf > gf > c-myb-/-) was carried out 4 weeks later. (B) Flow cytometric analysis of whole kidney marrow cells. The profile of the cellular source material for secondary transplant is indicated on the left (gf > gf > c-myb-/- [start]); the other panels indicate the profiles for cells at various time points after the second transplantation. The different cell types are tentatively assigned (c.f. legend to Fig. 1). (C) Genotyping assay indicating the presence of goldfish cells in the whole kidney marrow derived from secondary transplantation. (D) Macroscopic view of kidney after secondary transplantation. The location of the head kidney is indicated by oval. (E) Colonization of the thymus (T) after secondary transplantation (haematoxylin/eosin staining); G, gills. (F) T cell development in the thymus (T) after secondary transplantation (RNA in situ hybridization with rag1 probe). Scale bars, 50 µm. |

c-myb mutant hematopoietic cells are intrinsically defective. (A) Fluorescence microscopic representation of wild type and c-myb mutant embryos transgenic for gata1:DsRed and ikaros:eGFP reporters at 1 dpf; the caudal hematopoietic tissue is shown. Note the reduced number of fluorescent cells in the intermediate cell mass (ICM; indicated by white oval) of mutant embryos. (B) PCR assay for the detection of transgenes in wild type (wt) or c-myb mutant (c-myb-/-) fish; nTg, non-transgenic fish; dTg, double-transgenic for gata1:DsRed and ikaros:eGFP reporters. (C) Fluorescence microscopic appearance of the thymic region (T) of wild type (wt), cmyb mutant (c-myb-/-) fish and c-myb mutant fish transplanted with wild type zebrafish whole kidney marrow cells 4 weeks after transplantation (zfwt > c-myb-/-), all fish additionally double-transgenic for gata1:DsRed and ikaros:eGFP reporters (dTg). The bright red-fluorescent spots are caused by non-cellular background. (D) Reconstitution of hematopoiesis after transplantation of zebrafish wild type cells into c-myb mutants. Histological sections of thymi (T) of wild type and reconstituted animals are shown; G; gills. The inset is a 4x higher magnification indicating the dense repopulation with small lymphocytes. Abbreviations are as in (A) and (B). (E-G) Flow cytometric profiles of zebrafish of the indicated genotypes additionally transgenic for gata1:DsRed and ikaros:eGFP reporters, recorded using an AriaFusion instrument. Light scatter profiles are shown in the left-most columns; fluorescence profiles are indicated for the four major cell populations (red, erythrocytes, second columns; blue, lymphocytes, third columns; green, myelomonocytic cells, fourth columns; magenta, progenitor cells, fifth columns). (E) Flow cytometric profiles of wild type zebrafish (data representative of n=4). (F) Flow cytometric profiles of c-myb mutant zebrafish (data representative of n=3). (G) Flow cytometric profiles of c-myb mutant zebrafish reconstituted with non-transgenic wild type cells (data representative of n=6). Scale bars, 50 µm. |
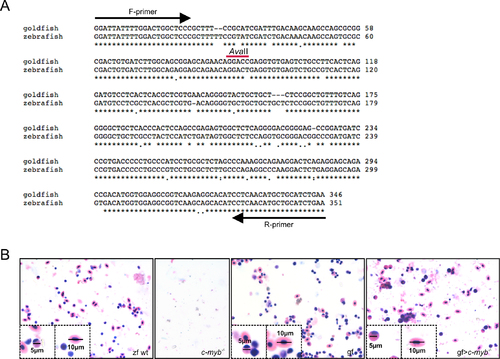
Characterization of reconstituted c-myb mutants. (A) Sequence comparisons of zebrafish and goldfish activin beta A genes. The primer locations are indicated, as is the AvaII restriction site (GGWCC) in the goldfish sequence. (B) Giemsa staining of whole kidney marrow cells indicating the different sizes of zebrafish and goldfish cells. Zebrafish wild type (zf wt), c-myb mutant (c-myb-/-), goldfish (gf) and c-myb mutant fish transplanted with goldfish whole kidney marrow cells 4 weeks after transplantation (gf > c-myb-/-). The insets highlight individual cell types with scale bars indicated. |
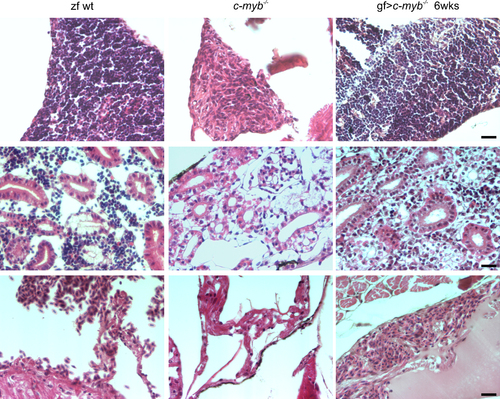
Histological analysis of reconstituted c-myb mutant animals. Sections of the thymus (top panels), kidney (middle panels), and heart (bottom panels) are shown (see also Fig. 2) for wild type zebrafish (zf wt), c-myb mutant (c-myb-/- ), and c-myb mutant transplanted with goldfish whole kidney marrow cells 6 weeks after transplantation (gf > c-myb-/-). All fish are 12 weeks old. Scale bar, 20 µm. |